Understand BRM Results

1. What results does the BRM provide?

By completing the BRM you will receive the following results:


One Total Score – Each completed BRM self-assessment will result in one finite score out of 100 i.e. a percentage.  We have created one score that is simple to communicate, and easy to understand. This can be used to benchmark yourself against peers and share with stakeholders in a clear and transparent way.


ESG Scores – In addition, each company will receive a score for each Pillar of activity –  Environment, Social and Governance and additional scores for each Impact area (e.g., climate, workers, ethics and behavior). These will be a useful way to show how you are progressing in each area.


Improvement Report – Each company will receive an Issues and Opportunities Report which highlights the importance and criticality of the topic and gives recommendations about how to improve.

2. How does the scoring methodology work in the BRM?

In practice, each question in the BRM 2022 is worth a specific number of points out of 100. The number of points a question is worth depends on the organizational type of the survey taker (i.e., the BRM path taken: Brand, Retailer, Brand & Retailer). Since Brands and Retailers answer a different number of questions, their possible question scores will vary. It is important to note that in the BRM assessment all questions, except the data submission requests, are scored and visible.


How are Questions Scored?

The BRM has been created to encourage Brands and Retailers to focus on real action, impact and results. For this reason, the questions and topics most pertinent and urgent to the Apparel, Footwear and Textile Industry may score more highly than others. 

To achieve this, points allocation across Pillars, Impact Areas, and Due Diligence Steps has been designed to reward activity and progress on specific actions. Ultimately, total points per question vary depending on where the question is found in the assessment and how many questions there are in that same section.

You can refer to the two tables below to get an overview of how points have been allocated across sections and questions in the BRM assessment:

Table 1:  Points per Section

Section Points Per Section
Climate 13.1
Water 7.9
Waste 13.1
Chemicals 7.9
Biodiversity 5.3
Total Environment 49.9
Social General 2.7
Workers 13.4
Employees 8.1
Consumers 5.4
Communities 5.4
Total Social 34.9
Governance General 3
Structure and Management 6
Ethics and Behavior 6.2
Total Governance 15.2

Table 2:  Points per Question

Pillar Impact Area Due Diligence Step No. of questions Points per question
Environment General  Risk assessment 7 0.2
Policy and commitments 3 0.4
Climate    Measurement and targets 5 0.8
Implementation and results 13 0.5
Communication 1 1.3
Collaboration 3 0.4
Water    Measurement and targets 5 0.5
Implementation and results 7 0.6
Communication 1 0.8
Collaboration 3 0.3
Waste    Measurement and targets 5 0.8
Implementation and results 15 0.4
Communication 3 0.4
Collaboration 6 0.2
Chemicals    Measurement and targets 7 0.3
Implementation and results 20 0.2
Communication 3 0.3
Collaboration 4 0.2
Biodiversity    Measurement and targets 2 0.8
Implementation and results 6 0.4
Communication 1 0.5
Collaboration 2 0.3
Social General  Risk assessment 9 0.1
Policy and commitments 12 0.1
Workers    Measurement and targets 10 0.4
Implementation and results 31 0.2
Communication 3 0.4
Collaboration 5 0.3
Employees    Measurement and targets 8 0.3
Implementation and results 6 0.7
Communication 3 0.3
Collaboration 2 0.4
Consumers    Measurement and targets 6 0.3
Implementation and results 11 0.2
Communication 1 0.5
Collaboration 1 0.5
Communities    Measurement and targets 4 0.4
Implementation and results 8 0.3
Communication 2 0.3
Collaboration 2 0.3
Governance General Risk assessment 2 0.7
Policy and commitments 8 0.2
Structure and management    Measurement and targets 2 0.9
Implementation and results 8 0.4
Communication 1 0.6
Collaboration 1 0.6
Ethics and behavior    Measurement and targets 2 0.9
Implementation and results 12 0.3
Communication 2 0.3
Collaboration 1 0.6

If you’d like to understand to what extent each answer option contributes to the BRM total score, please refer to the following rule: 

  • If answer options are YES/NO, then 100% of total points will be awarded to the user if the chosen answer option is “Yes”, otherwise no points will be awarded.
  • If answer options are YES/PARTIAL YES/NO, then 100% of total points will be awarded to the user if the chosen answer option is “Yes”, 50% of total points will be awarded if the chosen answer option is “Partial Yes”, and no points if answer is “No”.

If answer options are multiple choice, then full points will be awarded to the user if 75% or more out of all answer options is selected, two thirds (⅔) of total points will be awarded if 50% out of all answer options is selected, one third (⅓) of total points will be awarded if 25% out of all answer options is selected, and no points if answer is “None”.

3. How to access BRM results?

Scores

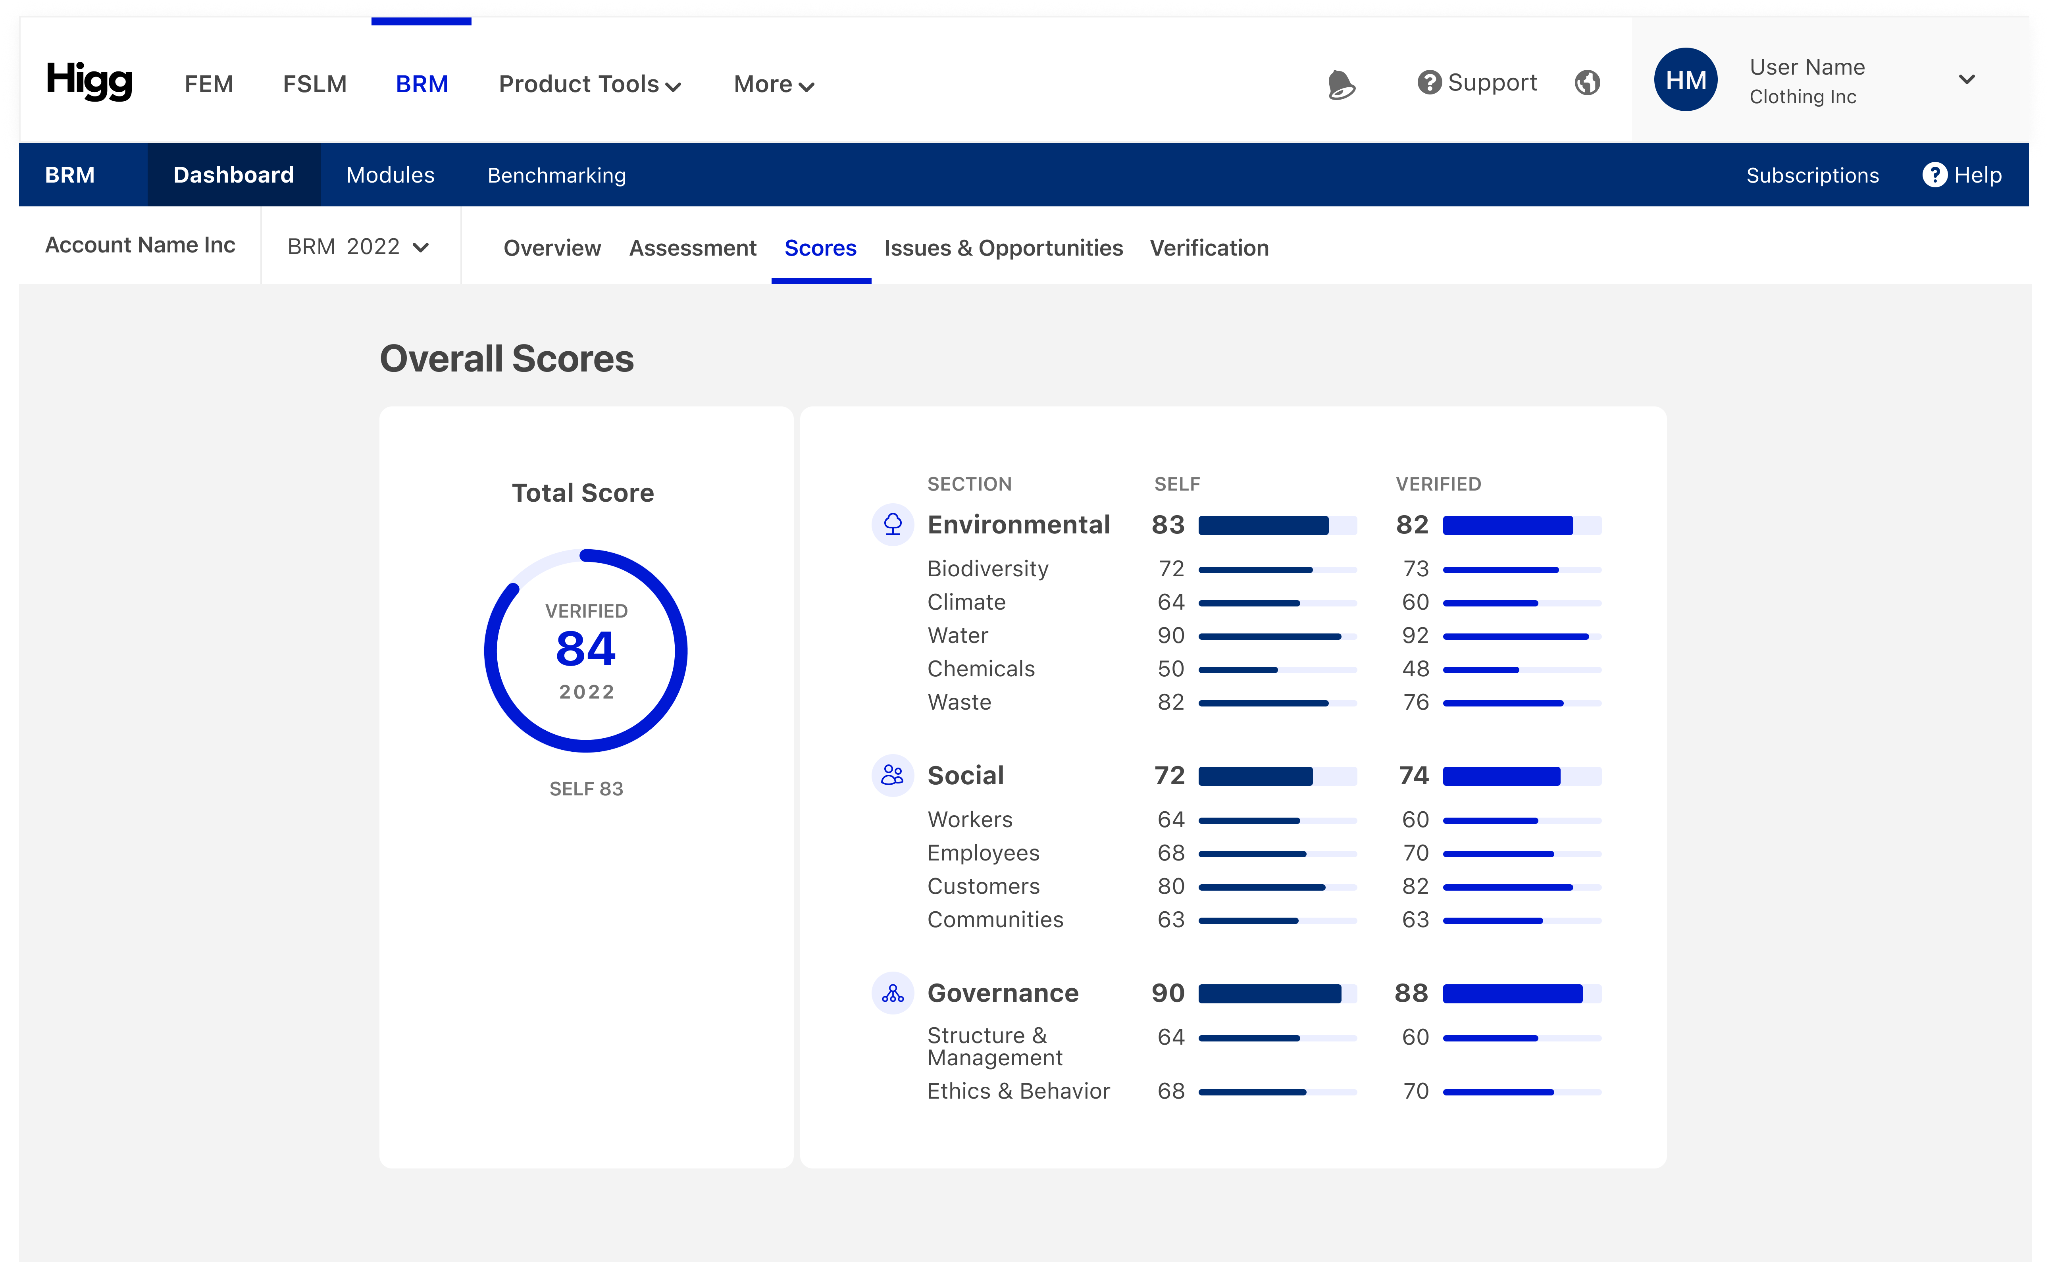
View your scores by clicking Scores in the BRM menu. Here you can see your total score, as well as the breakdown of your score for each pillar and impact area.

Scores are only visible once you have posted your assessment.


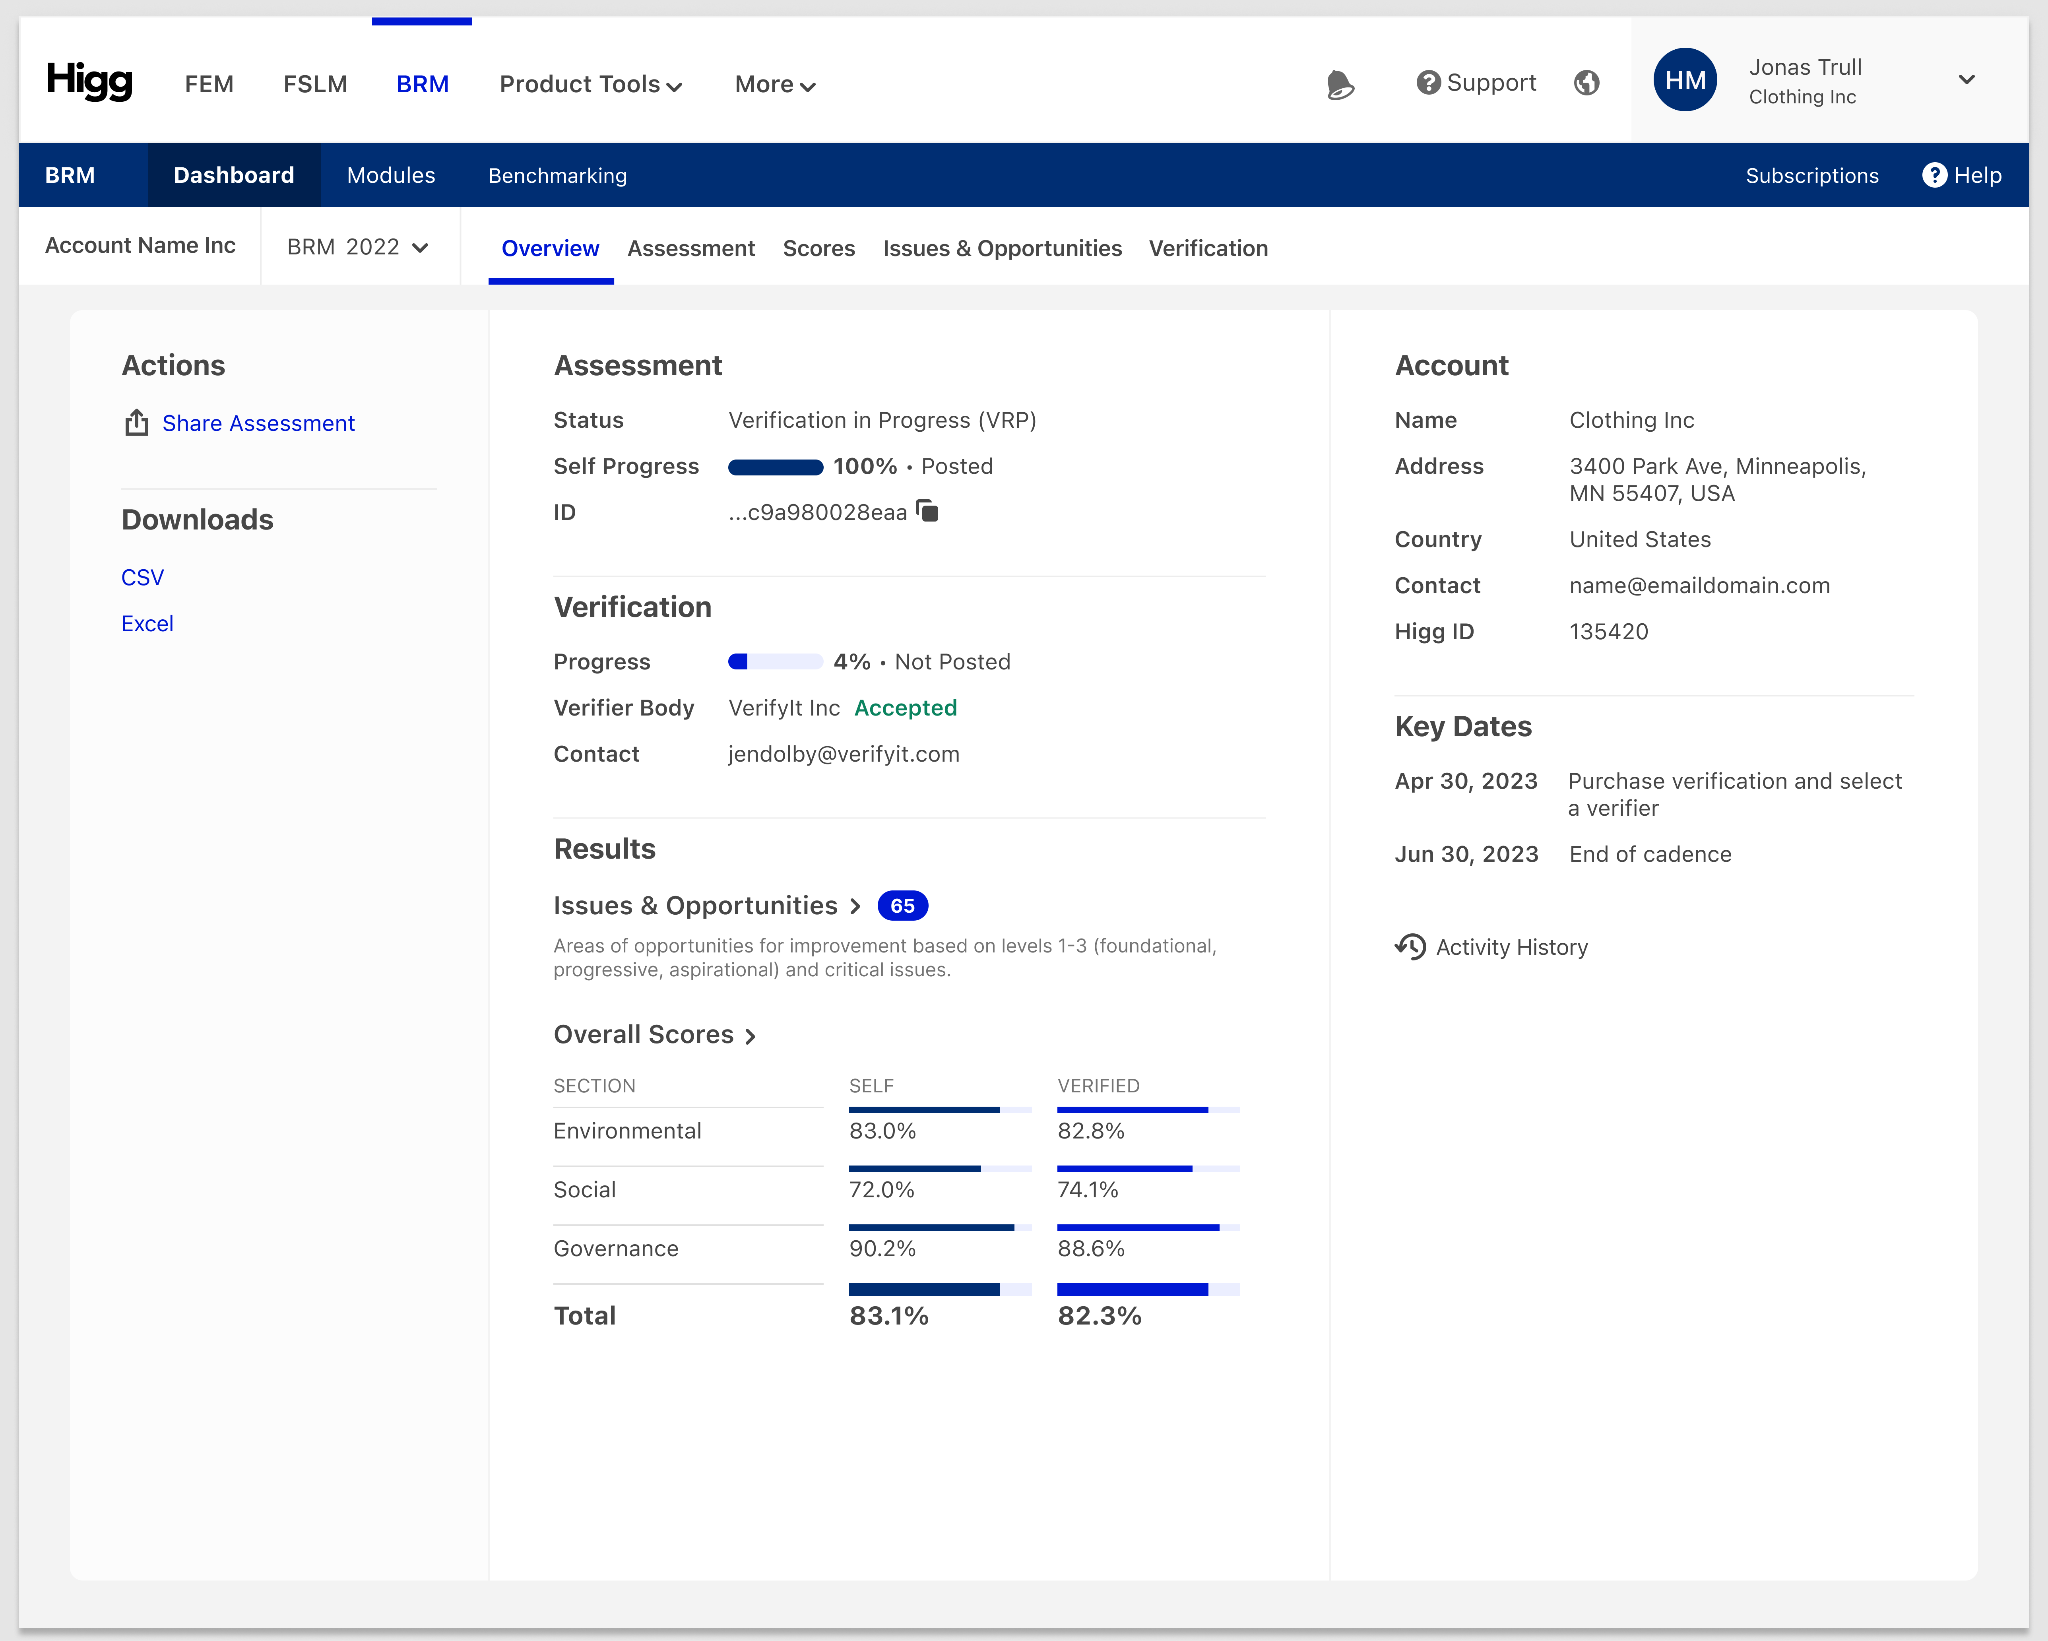
Your total score and pillar-scores are also visible on the BRM overview page:


Issues & Opportunities

Once you have completed and posted your Higg BRM module, you can look at the Critical Issues and Opportunities report. This report highlights critical issues and areas of opportunities for improvement. These improvement opportunities are based on three levels:

  • Critical
  • Level 1 – foundational
  • Level 2 – progressive
  • Level 3 – aspirational


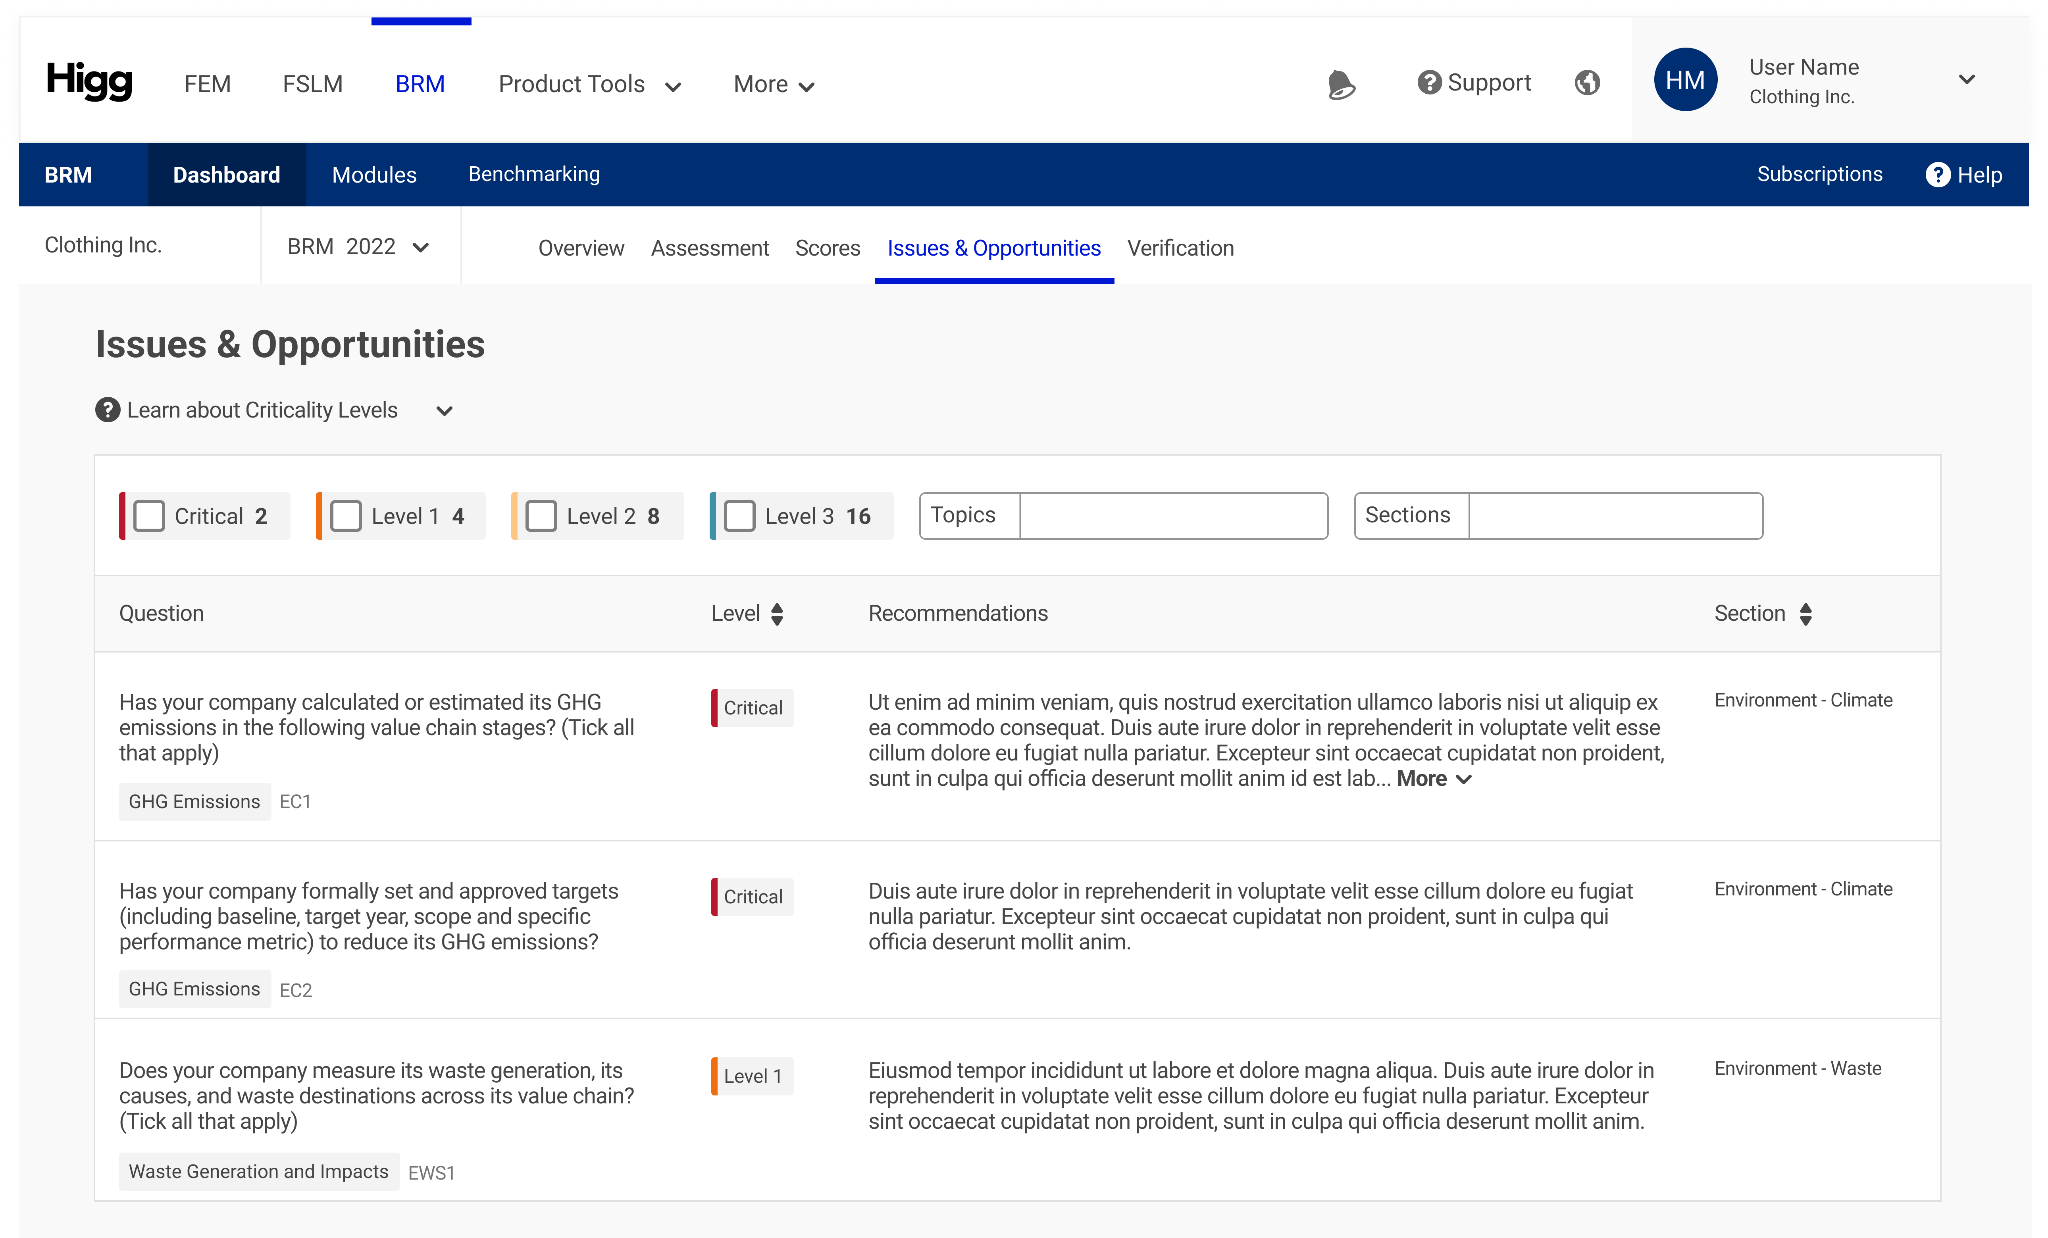
All negatively answered questions will be shown here, categorized by level of criticality. Use the filter options to dive into specific sections or topics and see where you can improve your sustainability efforts. In the third column, recommendations are listed for each question. Work with this guidance after completing the BRM to improve your company’s ESG efforts on a continuous basis and to show year on year progress.


4. How to improve on BRM results?

At the end of your Assessment you will receive your scores (See Q.1 What Results does the BRM Provide). With these results you will be able to compare and benchmark yourself with other brands or retailers which can be used to plan improvement activities. In addition, as explained in the previous section, by using the Issues and Opportunities Report your organization will be able to get insights to help internal teams establish a roadmap to progress and score improvement for subsequent BRM Cadences. 

Want to validate your results?