How To Get Started
The Analytics dashboard is designed to help you better understand the performance of your supplier base and their Higg FEM data and results. For detailed information, please refer to the ‘How To Use The Tool’ section.
1. How To Use The Tool
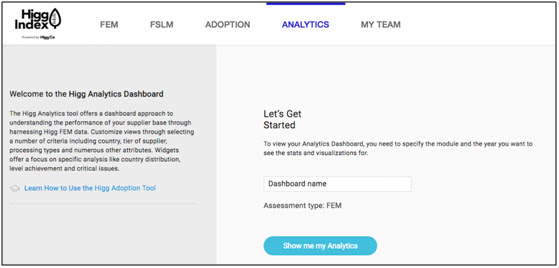
Upon first access to the analytics home page, you will enter your dashboard name and click the “Show me my Analytics” button to see the Analytics board. The assessment type is defaulted as FEM for now.
2. Navigate the Analytics Dashboard
Upon first access to the analytics home page, you will enter your dashboard name and click the “Show me my Analytics” button to see the Analytics board. The assessment type is defaulted as FEM for now.
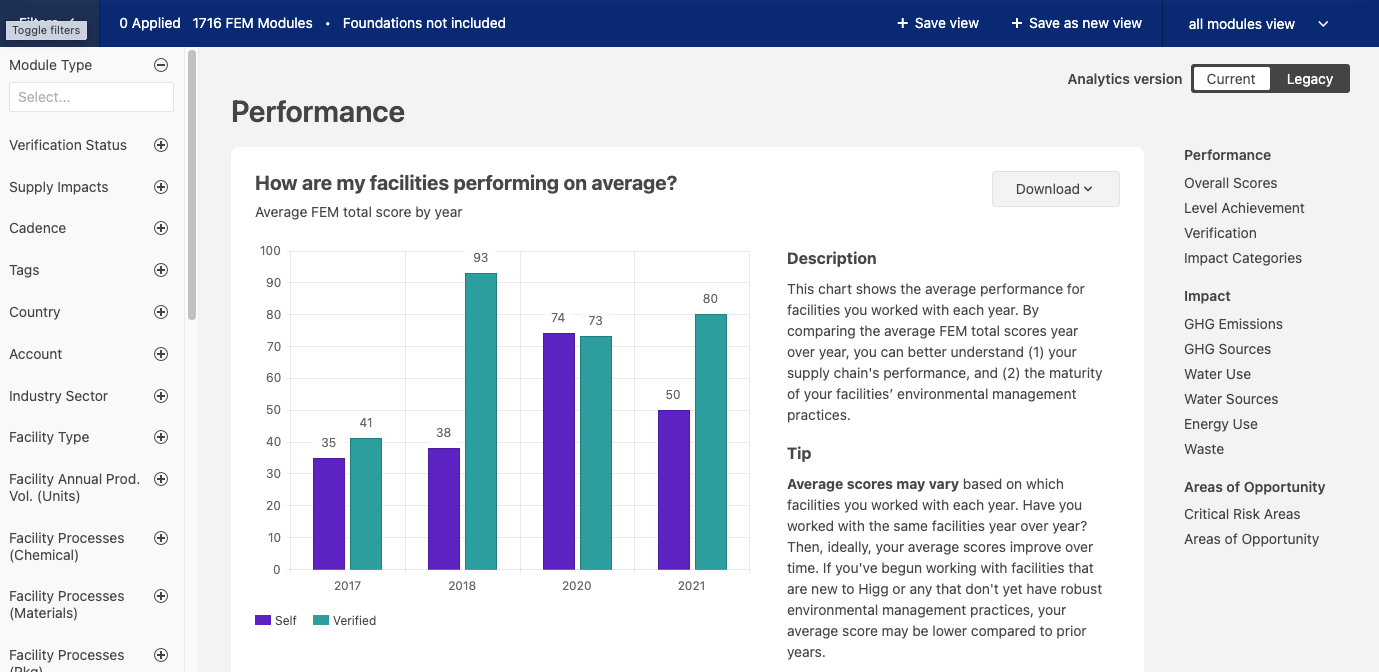
Understand your Analytics dashboard when you first access: the total number of modules (including FEM and vFEM since 2017) in your Analytics dashboard are the total number of modules shared with your account. You can refer to the data on the screenshot below. (i.e. total 1716 modules on this Analytics dashboard).

The Analytics dashboard includes 3 sections with 12 visualizations that produce different views of your Higg shared data:
- Performance
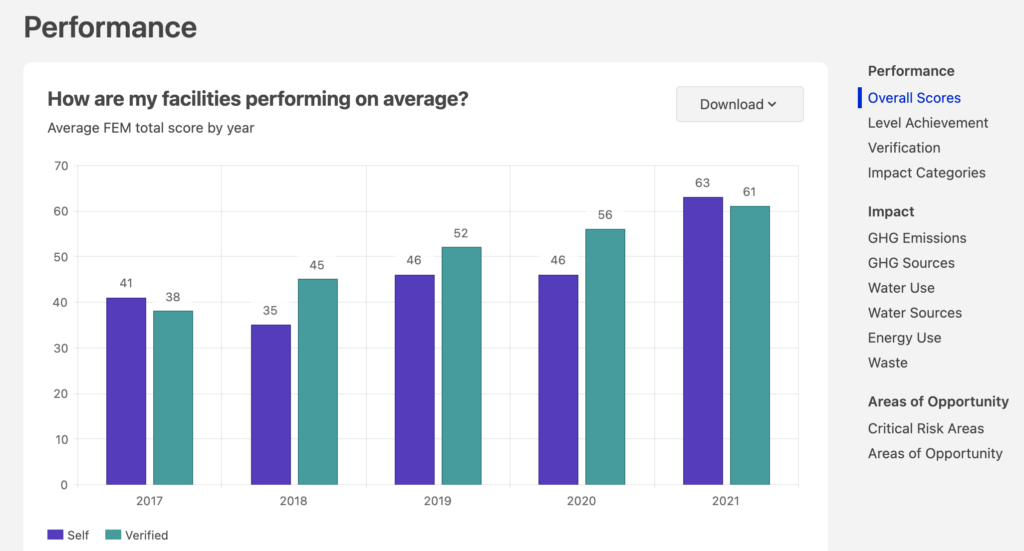
- Overall Scores – This chart shows average FEM total scores for facilities that have posted and shared their modules with you.
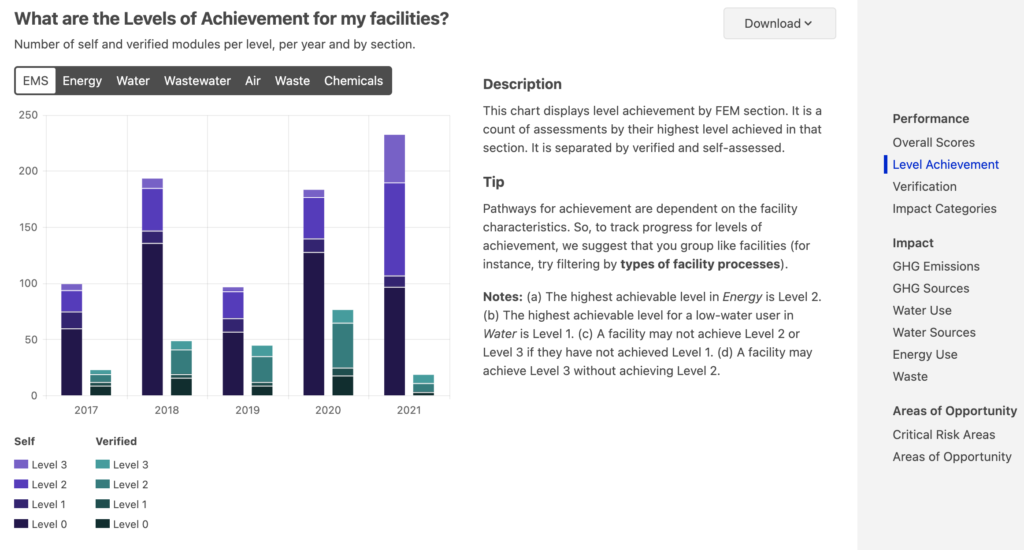
- Level Achievement – This chart displays level achievement by FEM section. It is a count of assessments by their highest level achieved in each section.
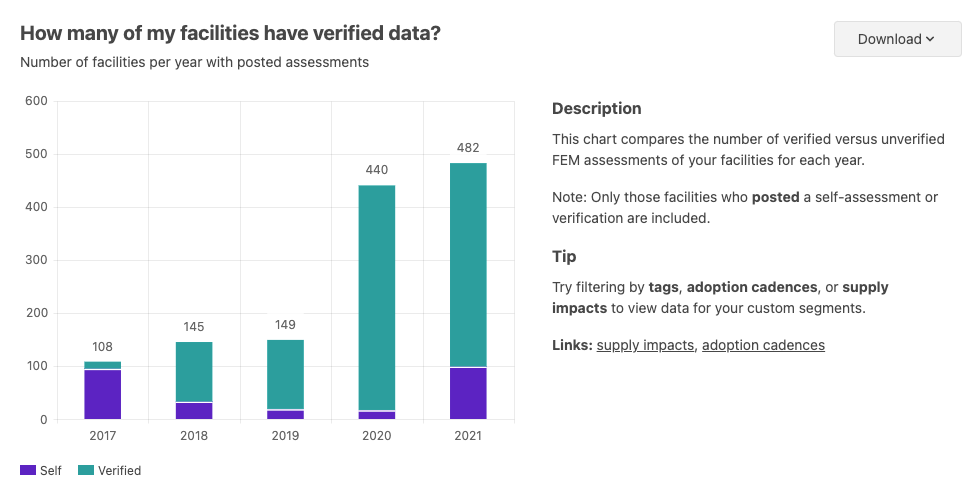
- Verification – This chart compares the number of verified versus unverified FEM assessments of your facilities for each year.
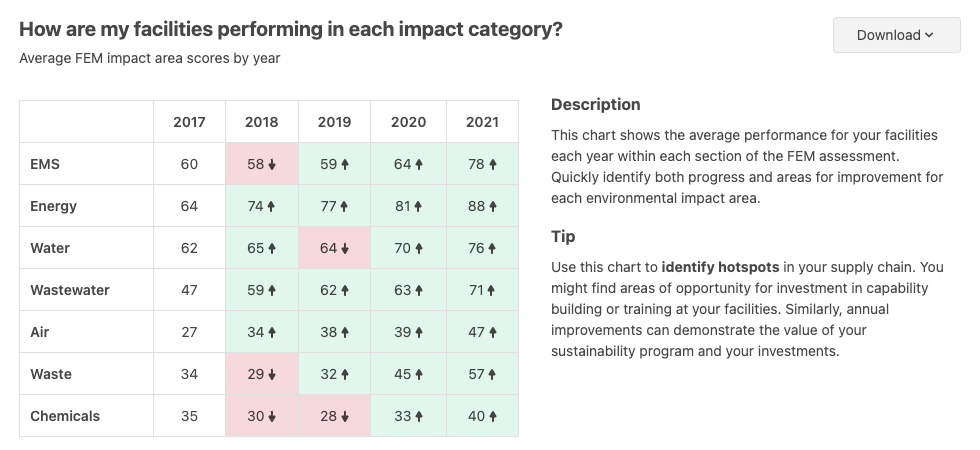
- Impact Categories – This chart shows the average FEM impact area scores by year
- Impact
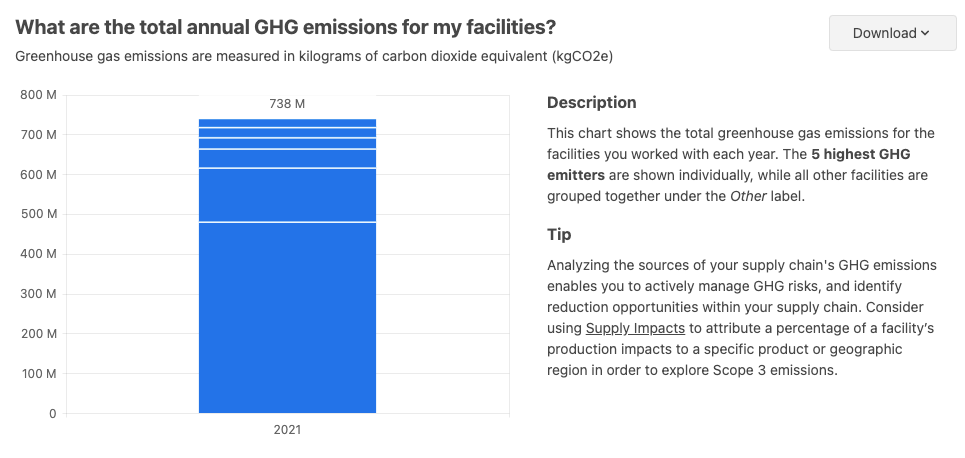
- GHG Emissions – This chart shows the total annual greenhouse gas emissions for the facilities you worked with each year. The 5 highest GHG emitters are shown individually, while all other facilities are grouped together under the Other label.
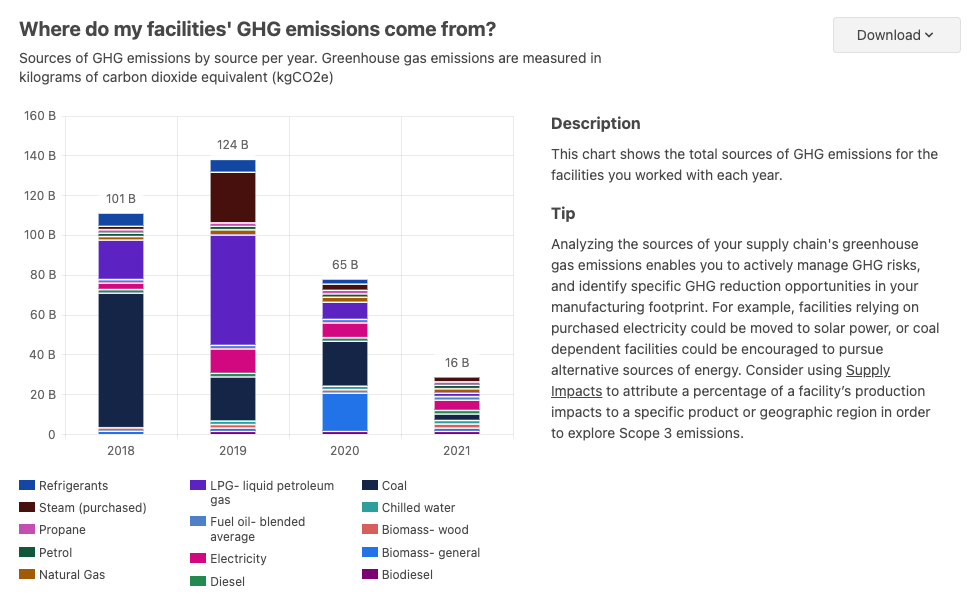
- GHG Sources – This chart shows the total sources of GHG emissions for the facilities you worked with each year.
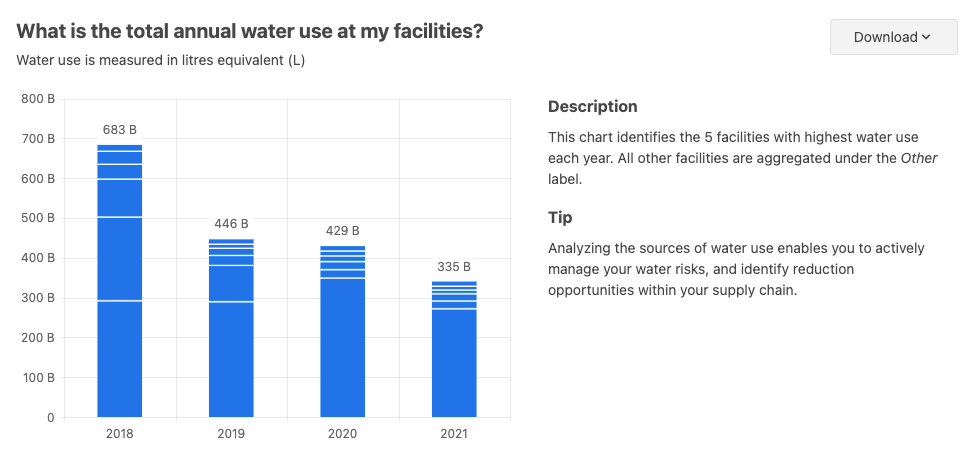
- Water Use – This chart identifies the 5 facilities with highest water use each year. All other facilities are aggregated under the Other label.
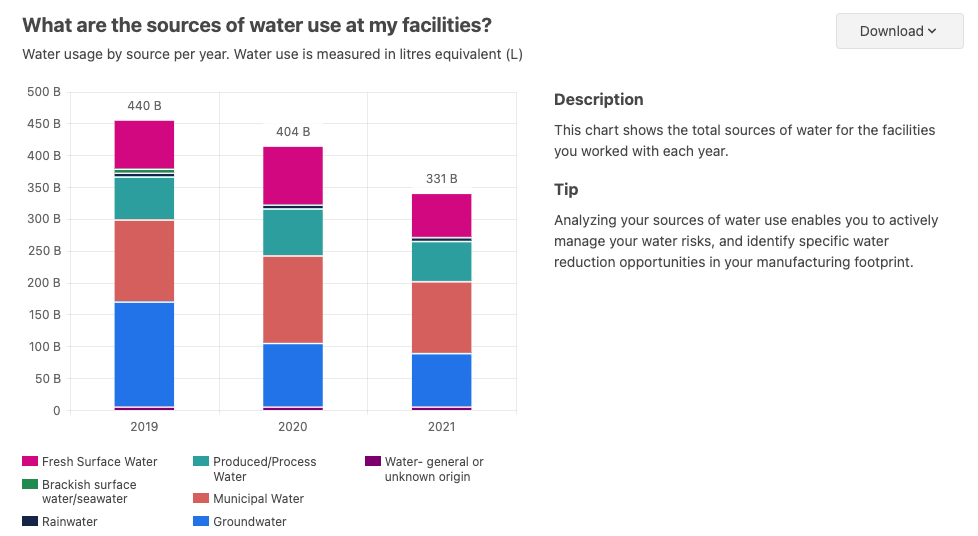
- Water Sources – This chart shows the total sources of water for the facilities you worked with each year.
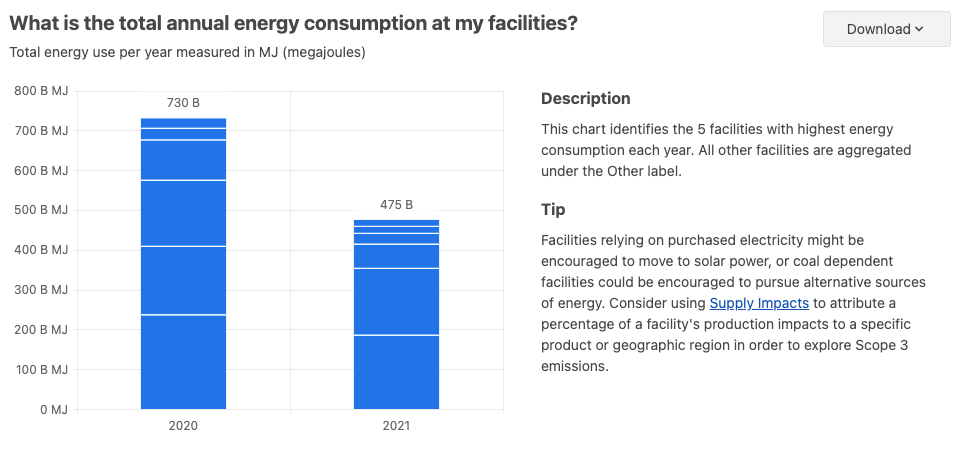
- Energy Use – This chart identifies the 5 facilities with highest energy consumption each year. All other facilities are aggregated under the Other label.
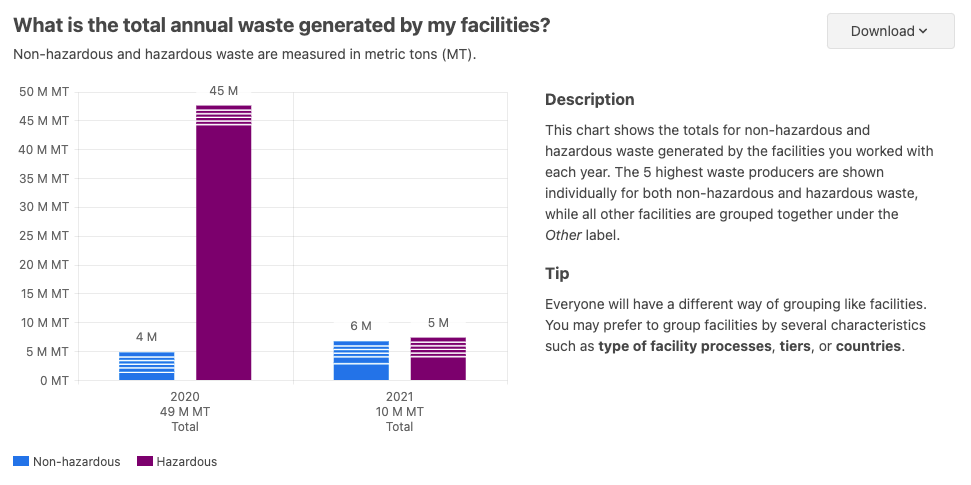
- Waste – This chart shows the totals for non-hazardous and hazardous waste generated by the facilities you worked with each year. The 5 highest waste producers are shown individually for both non-hazardous and hazardous waste, while all other facilities are grouped together under the Other label.
- Areas of Opportunity
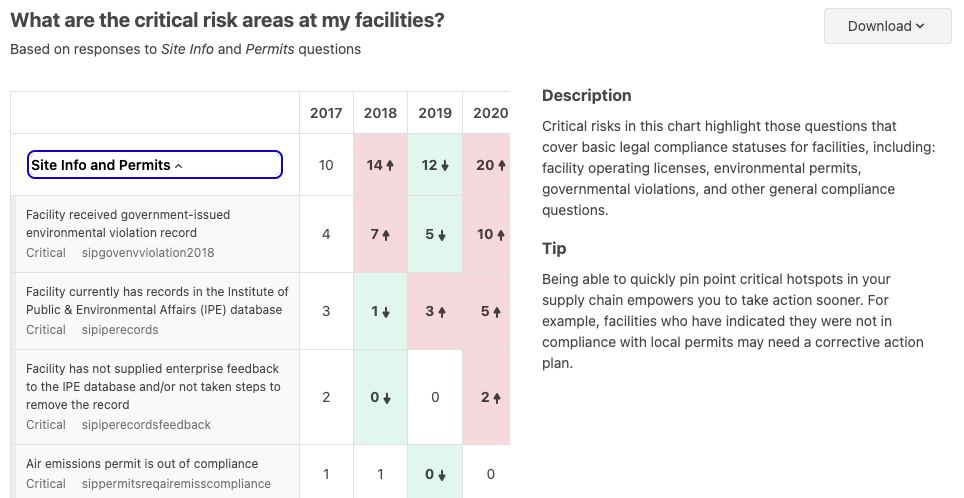
- Critical Risk Areas – Critical risks in this chart highlight those questions that cover basic legal compliance statuses for facilities, including: facility operating licenses, environmental permits, governmental violations, and other general compliance questions. They are baed on responses to Site Info and Permit questions.
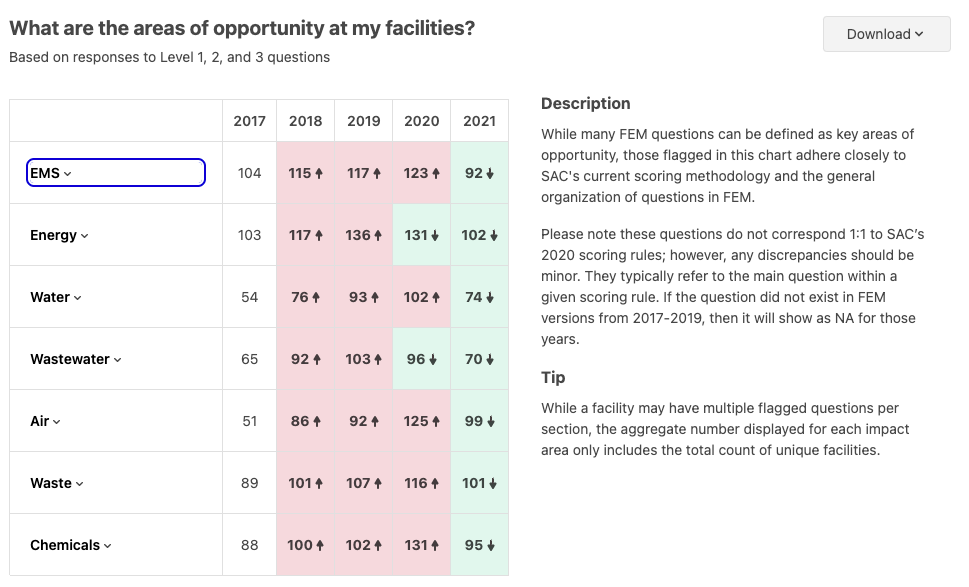
- Areas of Opportunity – See areas of opportunity based on responses to Level 1, 2, and 3 question. While many FEM questions can be defined as key areas of opportunity, those flagged in this chart adhere closely to Cascale’s current scoring methodology and the general organization of questions in FEM.
3. Create Your Own Analytics View
Upon first access to the analytics home page, you will enter your dashboard name and click the “Show me my Analytics” button to see the Analytics board. The assessment type is defaulted as FEM for now.
Attributes Selection Bar
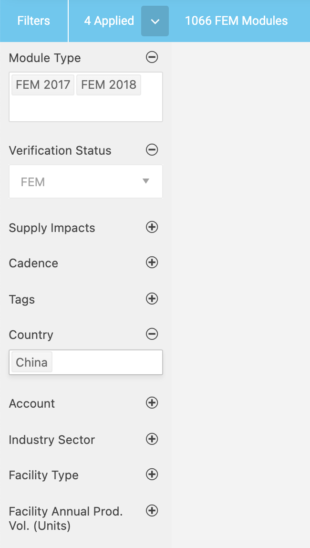
Click ‘Filters’ at the top left side on the blue bar, and an attributes selection bar will be shown. There are single selection attributes and multiple selection attributes. Once the attributes are selected, you will see them appear under the “Applied Filters” and total modules in the top blue bar. The more attributes you select, the smaller number of modules you will get.
Single selection attributes:
- Verification status: FEM or vFEM. Choose one and the module status will be shown.
Multiple selection attributes: Most of these facility-specific attributes are populated by the facilities in the Site Information & Permit section of FEM.
- Module type: FEM 2017, FEM 2018, FEM 2019, FEM 2020, FEM 2021. Choose one or multiple years and the total number of modules will be shown.
- Supply Impacts: if you have created a supply impacts footprint, you can apply that here.
- Cadence: choose a FEM default cadence and/or other cadences you have created.
- Tags: if you have added tags to shared FEM’s in the FEM modules page, you can apply those here.
- Country: choose one or multiple, the total number of modules will reflect the selected country(s).
- Account: choose one or multiple facility accounts the total number of modules will reflect the data for those accounts.
- Industry sector: choose one or multiple, the total number of modules will reflect the selected industry.
- Facility type: choose one or multiple, the total number of modules will reflect the selected facility type.
- Facility process: choose one or multiple, the total number of modules will reflect the selected facility process.
- Facility annual product volume (Unit): choose one or multiple, the total number of modules will reflect that product volume unit.
- Employee count: choose one or multiple, the total number of modules will reflect the selected range of employee count.
- Material type: choose one or multiple, the total number of modules will reflect the selected material type.
4. Save Your Analytics Dashboard View
Save Your Analytics Dashboard As New View
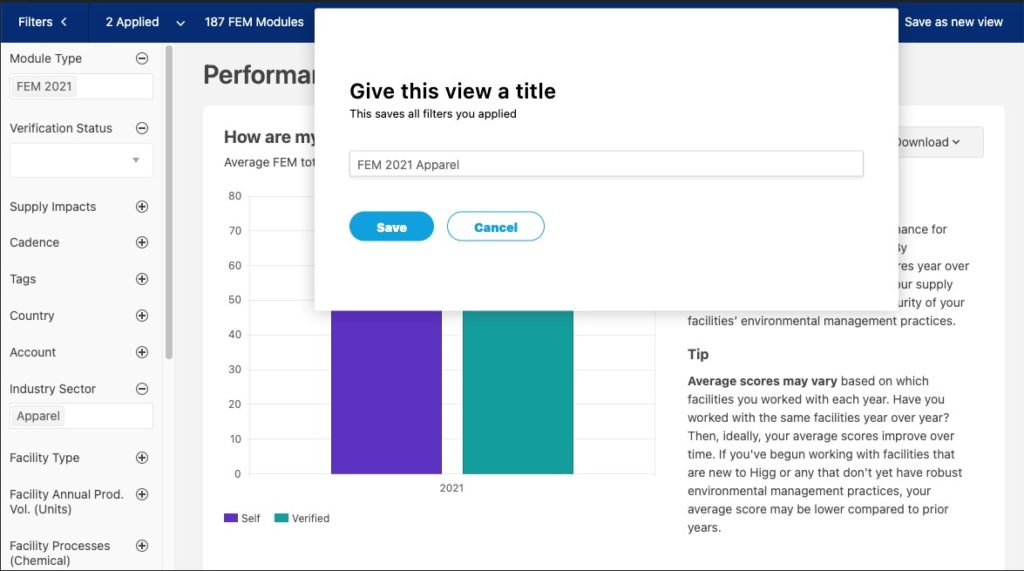
- If you want to create multiple views of module data, you can re-select the attributes and save the view as another new view by clicking “Save as new view” on the top right side of the blue bar.
- To find your saved new view, you can click the arrow icon to populate the drop-down list on the top right corner of the blue bar.
- You can share the link of this saved new view with your team members
- You can rename your saved new view
- You can export the saved new view to a CSV file
- You can delete the saved new view
- You can access other users’ saved Analytics dashboard views.