1. Access Module Data
To access module data and results reports, first please confirm that the FEM has been submitted and posted. Once it is posted, you can access the results reports from the FEM dashboard, as well as the CSV download for offline data analytics.
Please note – the CSV data download feature is only available for the Facility Plus Subscription.
2. Scoring
The Higg FEM gives users scores after completing the assessment. The score page includes total Higg Index scores, section scores, and Higg Index level achievements. On the score page users can:
- Evaluate the Higg FEM performance
- Track progress over time
- Compare the performance to that of similar facilities.
Please note: If a facility doesn’t have a valid business operation license, their FEM score will be 0.
To understand the scores and achievement levels, please review the Higg FEM scoring system guide: Higg FEM Scoring System Guidance.
Access the scores by going to your FEM dashboard, and clicking ‘View Details’.
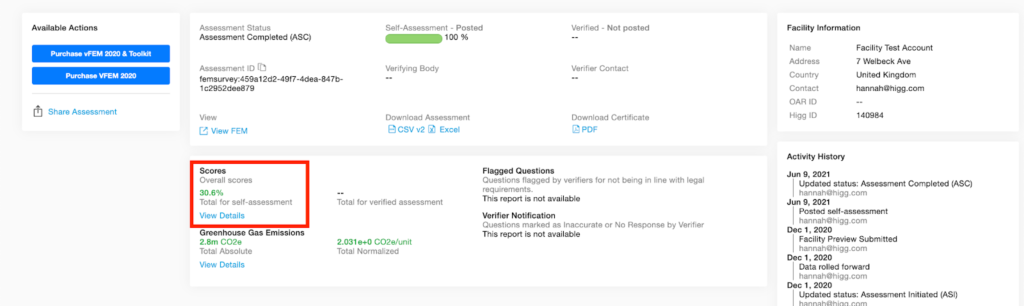
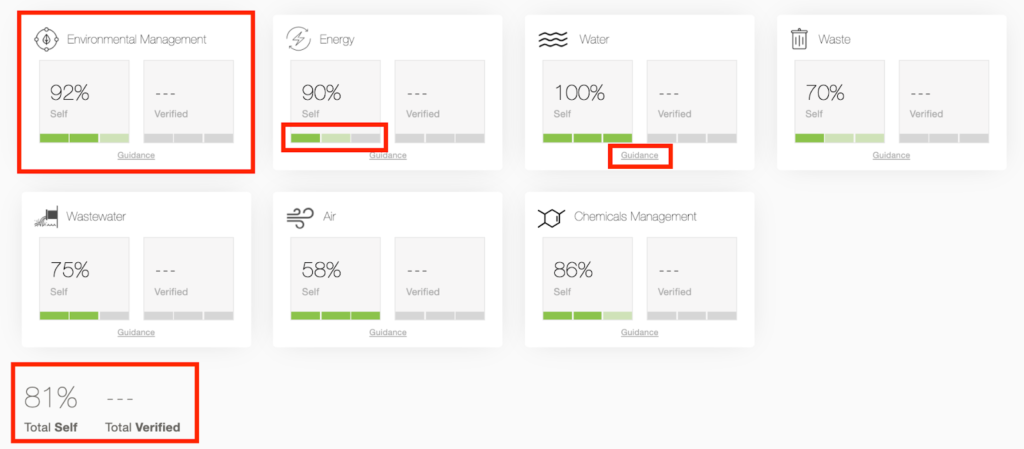
On the Scores page, you can see section and total scores. Additionally, you can see the level achievement for each section. For detailed information on the scoring for each section, click the ‘Guidance’ button to take you directly to scoring section guidance.
3. Benchmarking
Please note – benchmarking is only available for the Facility Plus Subscription.
The Higg benchmarking tool allows users to compare their FEM performance with all the industry data in the Higg platform. It helps users measure their performance compared to industry averages and highlights areas of focus and improvement for facilities. The industry benchmarking section focuses on level achievement and section and total scores. There are additional detailed benchmarking tabs for energy, waste and water use.
To access benchmarking, click the FEM tab and then select ‘Benchmarking’.
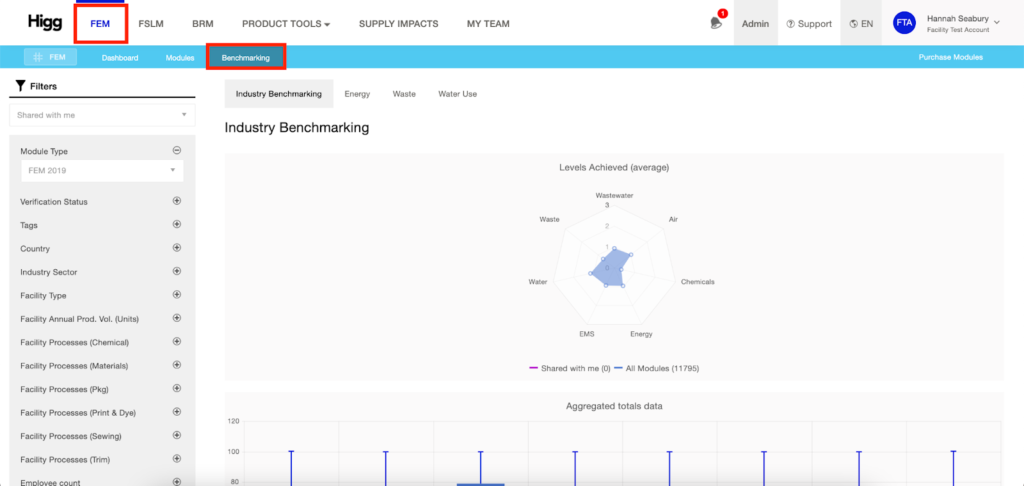
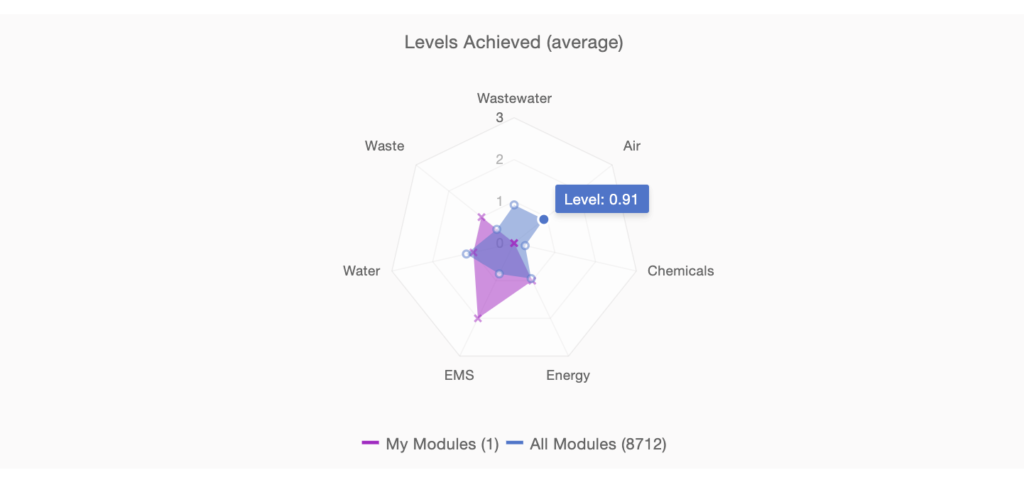
In the center of the page, see the ‘Levels Achieved (average)’ and the ‘Aggregated totals data’ sections. Across the benchmarking tool, your module data is shown in purple and the industry average is displayed in blue.
On the left, select one or multiple filters to narrow the industry data shown by module year, verification status, industry, and more. These filters allow you to compare your performance to facilities similar to yours.
‘Levels Achieved (average)’ – This section shows your facilities level achievement compared to industry averages. Higher level achievement indicates better environmental performance. For more detailed information, hover over any of the data points to see the actual value.
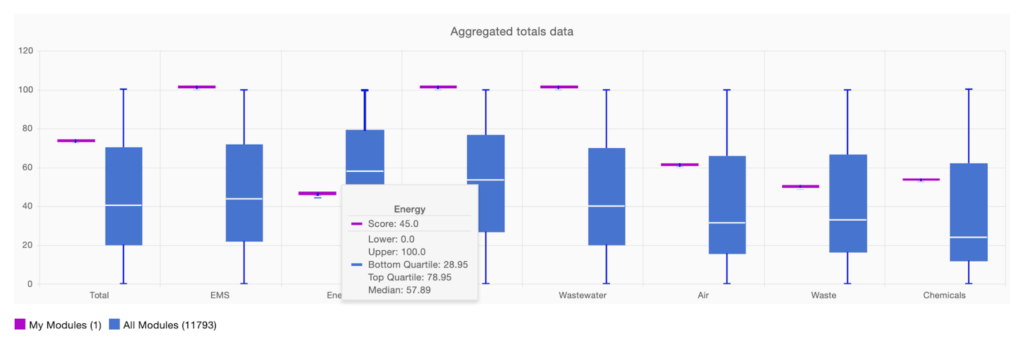
‘Aggregated totals data’ – The section shows your total and individual section scores compared to industry data. Hover over the chart to see more details. Industry data is displayed in specific bars that show:
- Upper = highest recorded score in our system
- Lower = lowest recorded score in our system
- Bottom quartile = 25% of modules scored below this number
- Top quartile = 25% of modules scored above this number
- Median = median score of all module
There are also charts showing additional information from the Energy, Waste and Water Use sections.
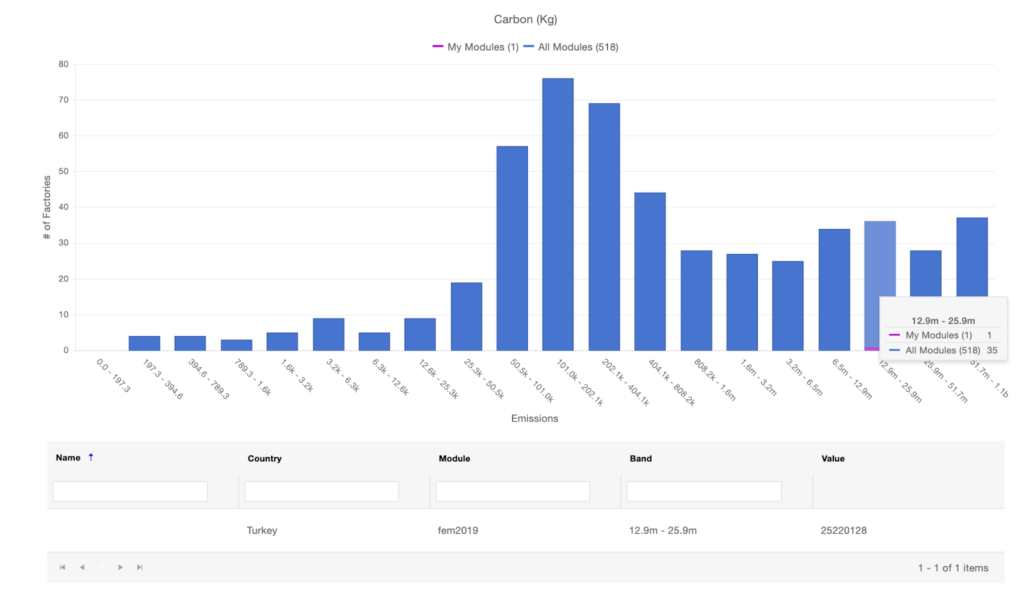
Energy – The energy section contains three charts and tables showing total energy use, total renewable energy use (if applicable), and carbon emissions. Each section shows a graph and beneath it a table with the actual numerical values and information about your facility.
Waste – The waste section contains two charts and tables showing non-hazardous waste and hazardous waste.
Water User – The water use section contains two charts and tables showing water withdrawal and water recycling.
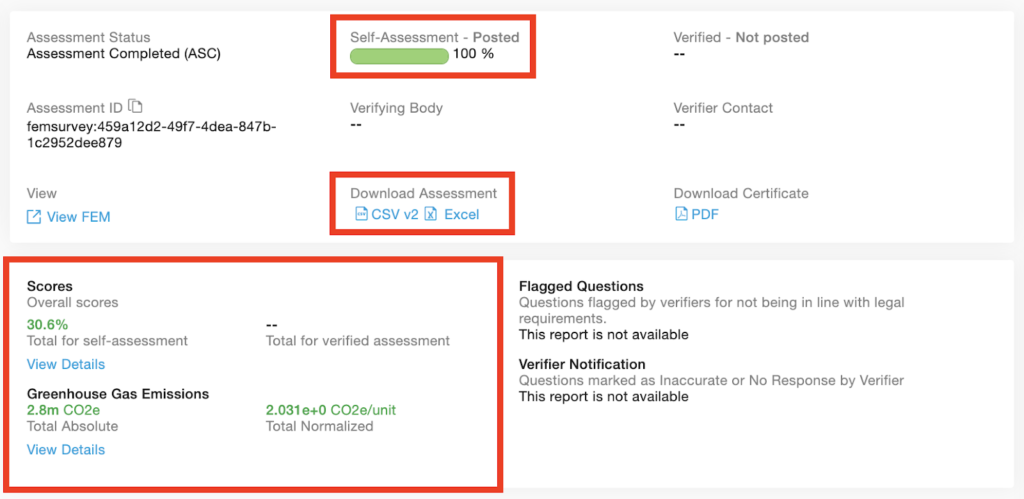
4. GHG Emissions Report
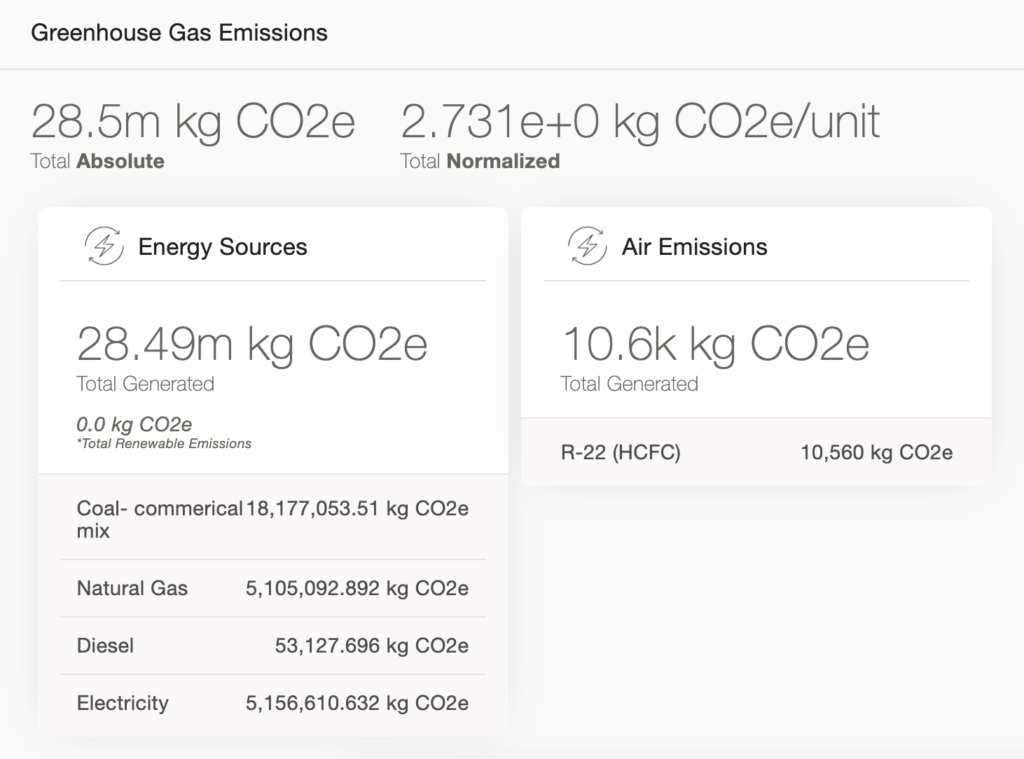
The Greenhouse Gas Emissions Report gives detailed information on the GHG emissions produced by your manufacturing process in absolute and normalized units, and renewable energy data. To see the individual sources, click ‘View Details’.
If your facility doesn’t report the energy and air emissions annual data, there won’t be data shown in the report.
For full information on the GHG report updates and calculations, please see the GHG revision page here.
5. CSV Data Analytics
Please note – the CSV data download feature is only available for the Facility Plus Subscription.
For additional information on how to read and understand FEM data, you can download the Bulk CSV Data Analytics guide below. The Bulk CSV includes 5 key sections of information in the following order:
- Account and module information
- Higg FEM scoring results for total, section, level, and question scores
- Air emission, wastewater, water and chemical management sections applicability
- All module response data (answers to module questions)
- All module verification data (including the verified result and corrected response)
- Total GHG emission amount and GHG calculations
Please use the Excel and PDF FEM data reference guide attached below to understand what the column headers in the bulk export are referring to (note there are three tabs):