How to Use the Tool
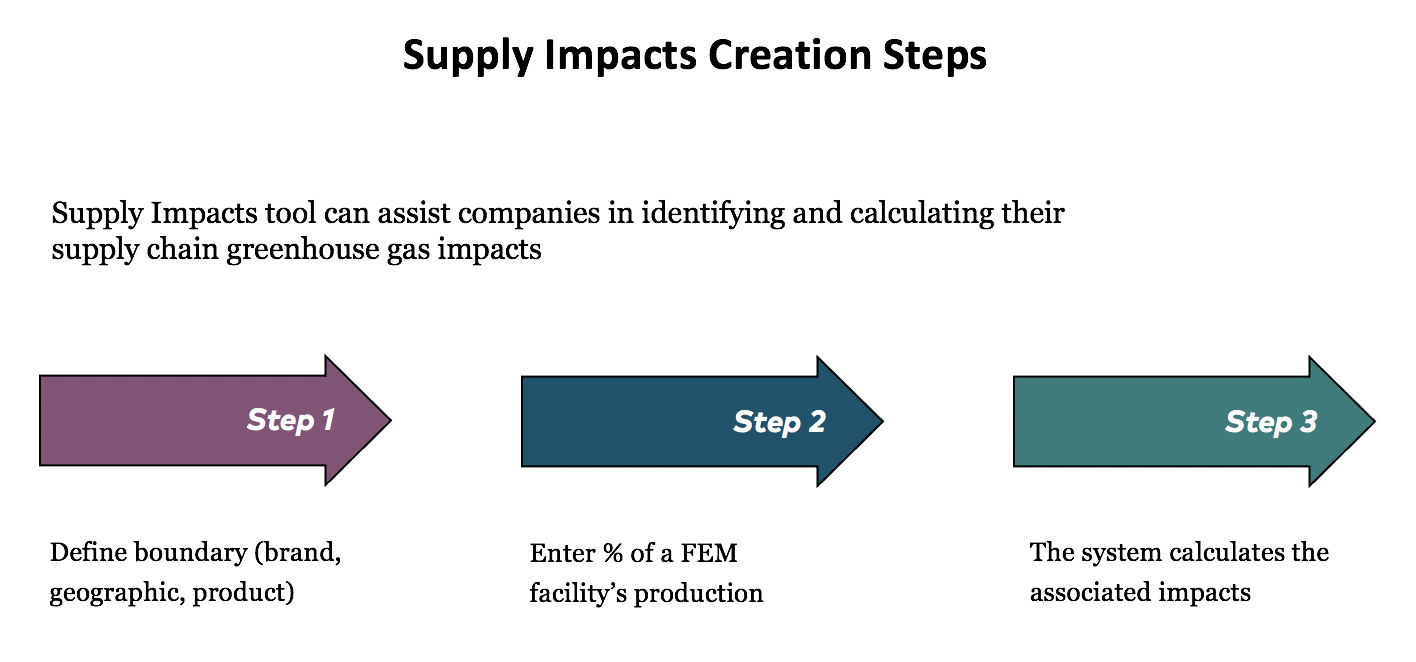
1. Supply Impacts Creation Steps
2. Accessing the Supply Impacts Feature
4. Allocating Production to Tiers
5. Estimating Allocations Best Practices
6. Analytics and Data Download
10. User Permission
1. Supply Impacts Creation Steps
2. Accessing the Supply Impacts Feature
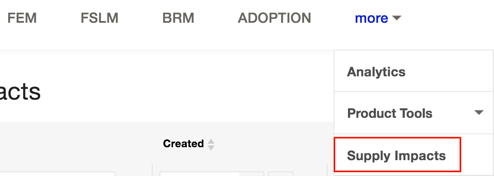
- Go to your Higg account and click “Supply Impacts” on the top menu. It will take you to the Supply Impacts tool home page.
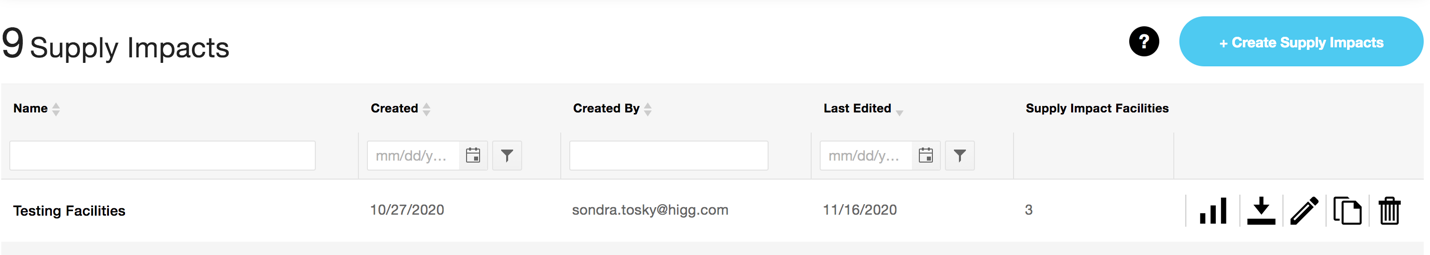
- On this home page, you can create a new impact, see all the impacts you have created and view and access the impacts. In addition, you can also search the impacts by the name, creation date, creator and the last edit date.
- For each created impact view:
- You can view the impacts name, created date, the person who created the impacts, the last edit date and total impacts allocation facilities.
 : You can access the impacts analytics data (only if you are expanded or advanced or custom service level account)
 : You can download the impacts data into a CSV file.
 : You can edit the created impacts.
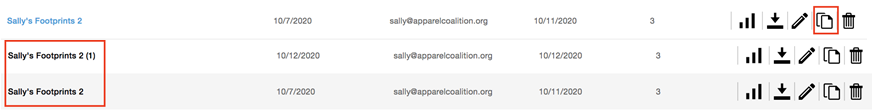
 : You can copy the created impacts and make it as a new one.
 : You can delete the created impacts.
3. Creating Impacts
Clicking “Create Supply Impacts” button on the supply impacts home page, you will start the process of creating a supply impact.
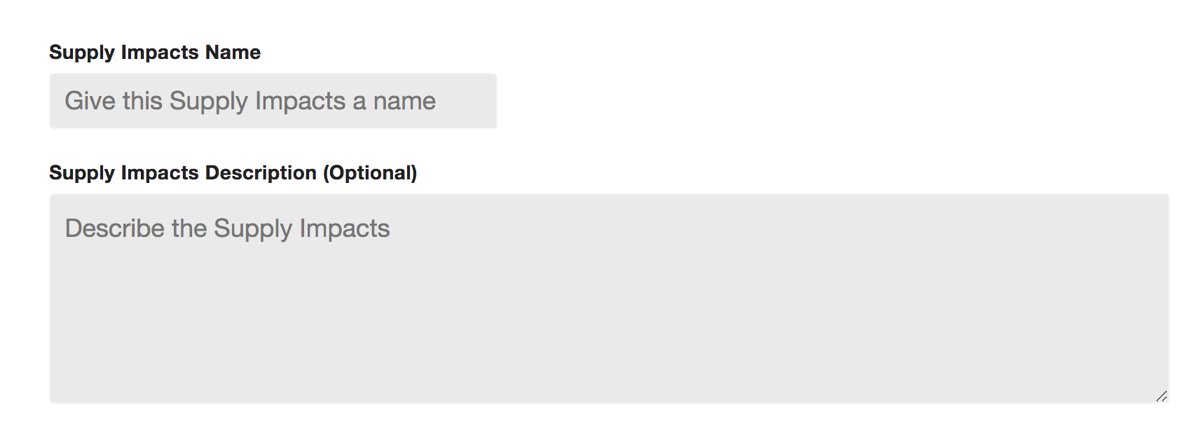
- Giving a name for your impacts. Providing the description is optional.
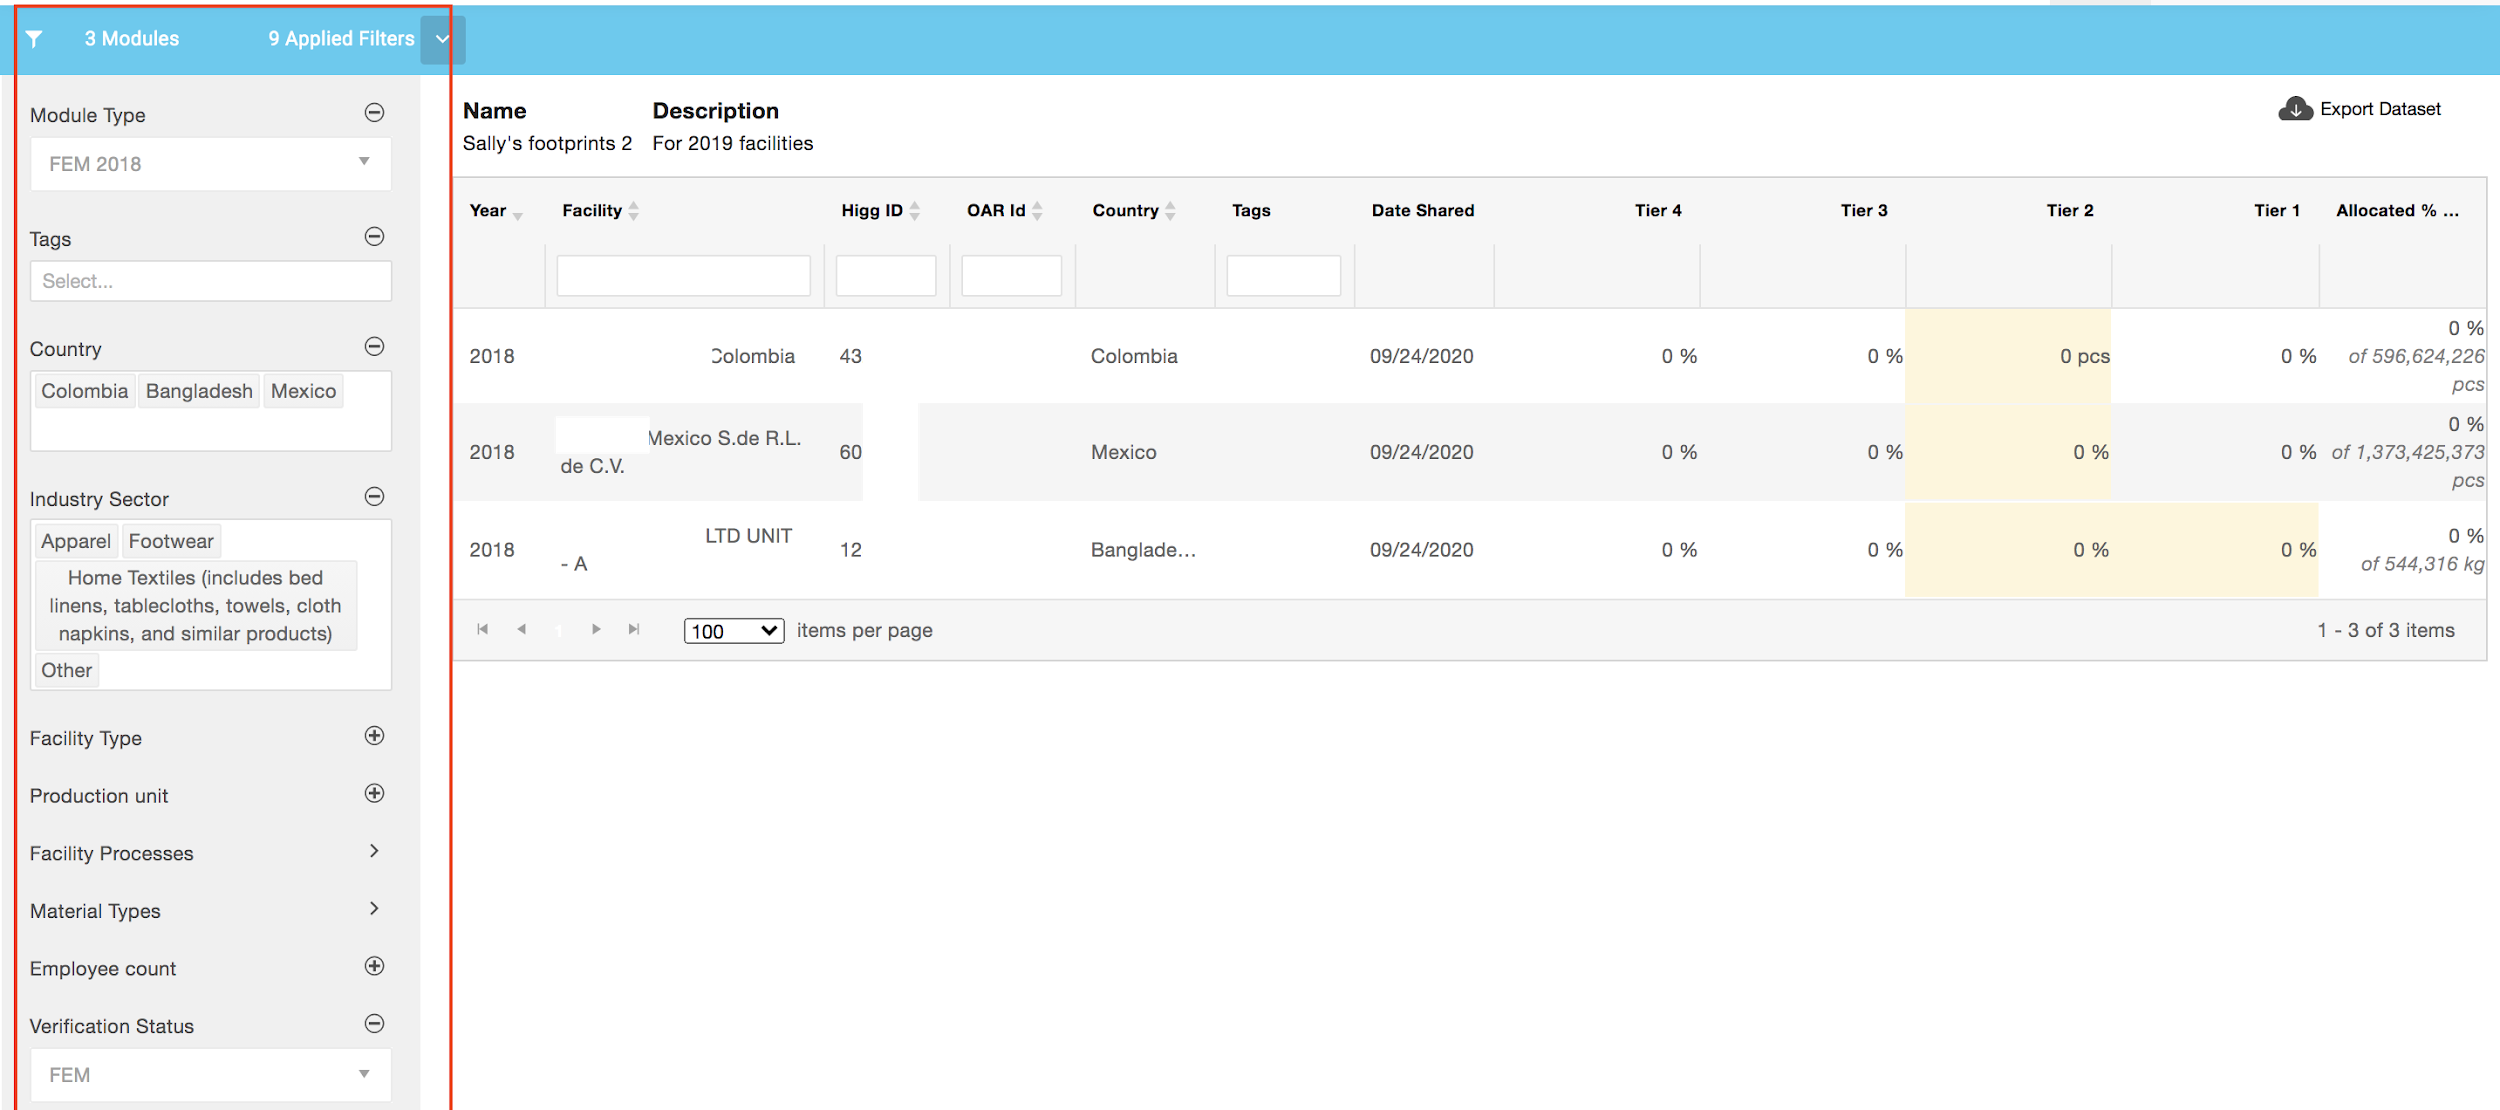
- Sort the filters to choose the facilities
Like the Higg FEM benchmarking and analytics tools, the Supply Impacts tool provides the filters for you to define the boundaries – select the facilities that you want to create the impacts. Select filters from the left-hand menu and select sort/filters from table columns.
Single selection filters:
- Module type: FEM 2017, FEM 2018, FEM 2019, FEM 2020. Choose one and the total number of modules will be shown as that module type.
- Verification status: FEM or vFEM. Choose one and the module status will be shown.
Multiple selection filters: The information in the Supply Impacts tool is populated by the facilities from the Site Information & Permit section of Higg FEM.
- Tag: the tag(s) entered on the FEM module page for marking the facilities.
- Country: choose one or multiple, the total number of modules will reflect the selected country(s).
- Industry sector: choose one or multiple, the total number of modules will reflect the selected industry.
- Facility type: choose one or multiple, the total number of modules will reflect the selected facility type.
- Facility process: choose one or multiple, the total number of modules will reflect the selected facility process.
- Production unit: square meter, meter, kilogram, unit, cubic meter.
- Employee count: choose one or multiple, the total number of modules will reflect the selected range of employee count.
- Material type: choose one or multiple, the total number of modules will reflect the selected material type.
- Allocated: allocated facilities or unallocated facilities
4. Allocating Production to Tiers
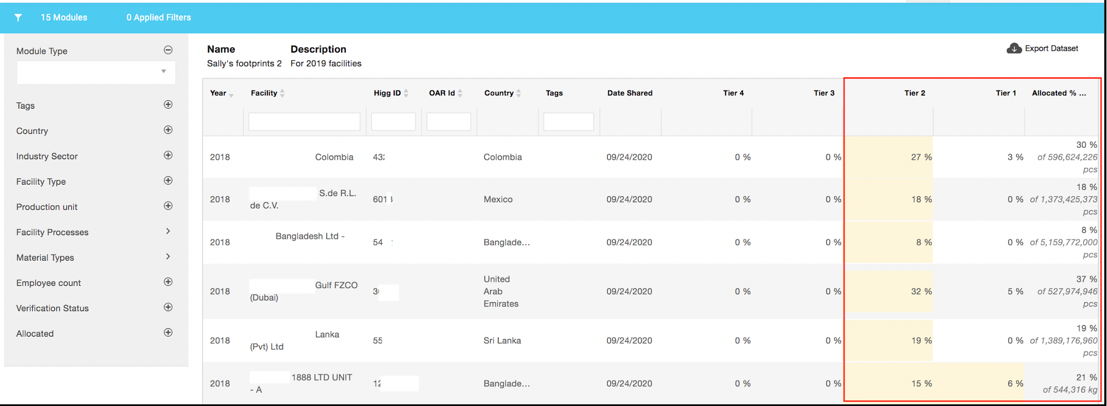
- Add allocation % of production to supply impacts
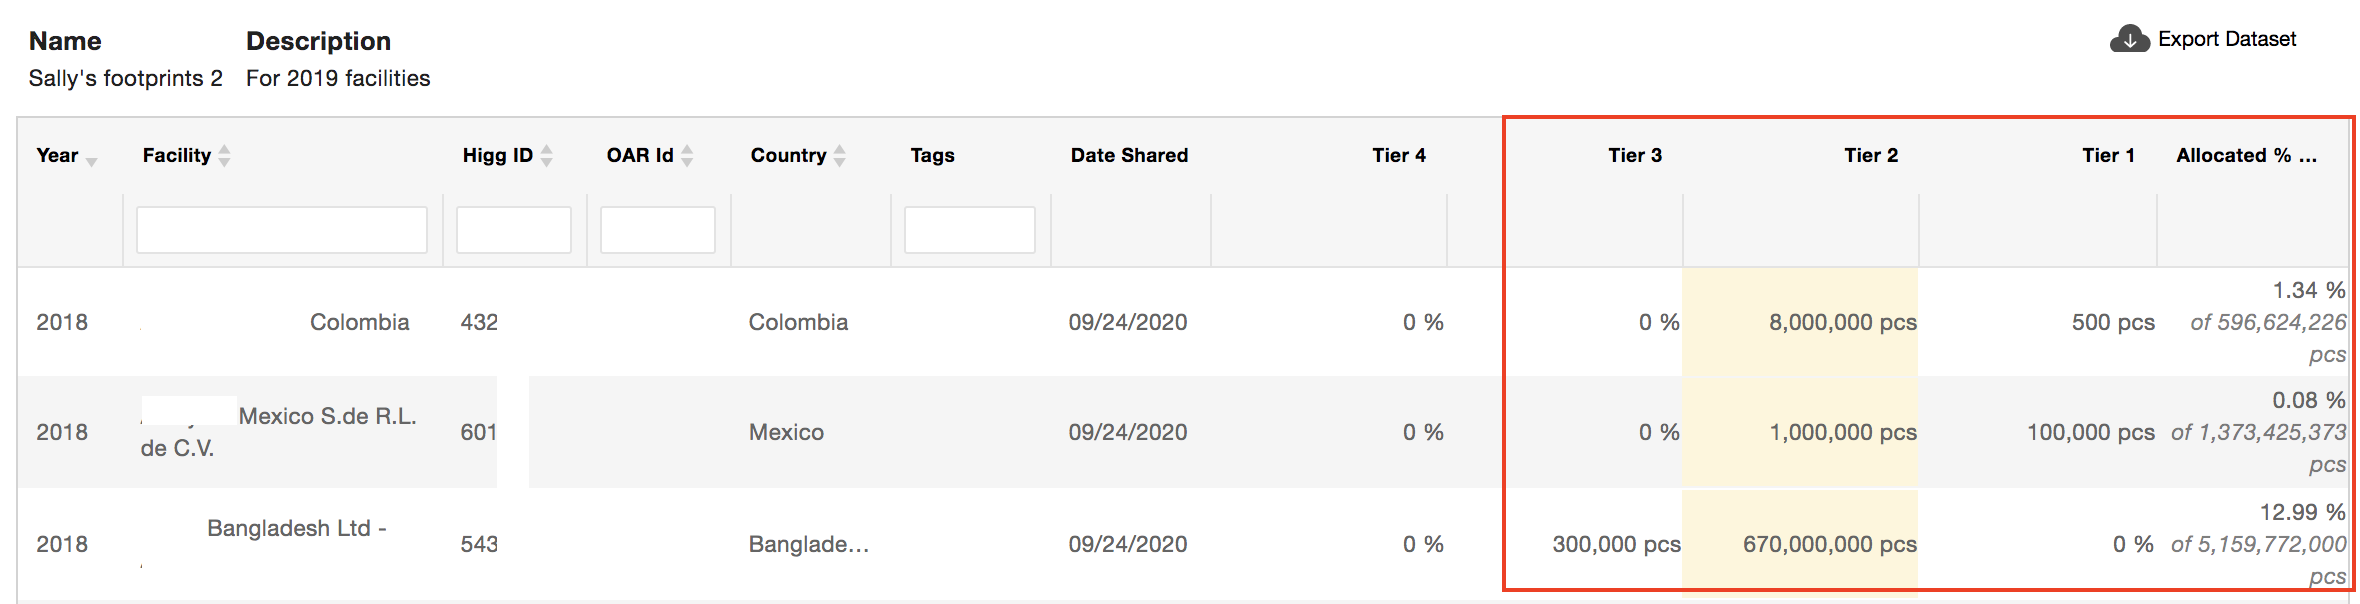
In any tier for a facility, you can enter a % allocation on the Supply Impact tool allocation board. Our system has automatically identified the tier(s) based on the processes self-selected by the facility in that year of Higg FEM and the identified tiers are highlighted in yellow. However, allocations can be filled out for multiple tiers (e.g., tier 1 and 2) for a facility. The final column shows the total annual facility production that the facility reported in the Higg FEM for that year. The percent is the allocated amount summed across the tiers as a percent of the total facility annual production. For example, if 10% is entered in Tier 1 and 20% in Tier 2, then the final column would show 30% of the facility annual production as allocated.
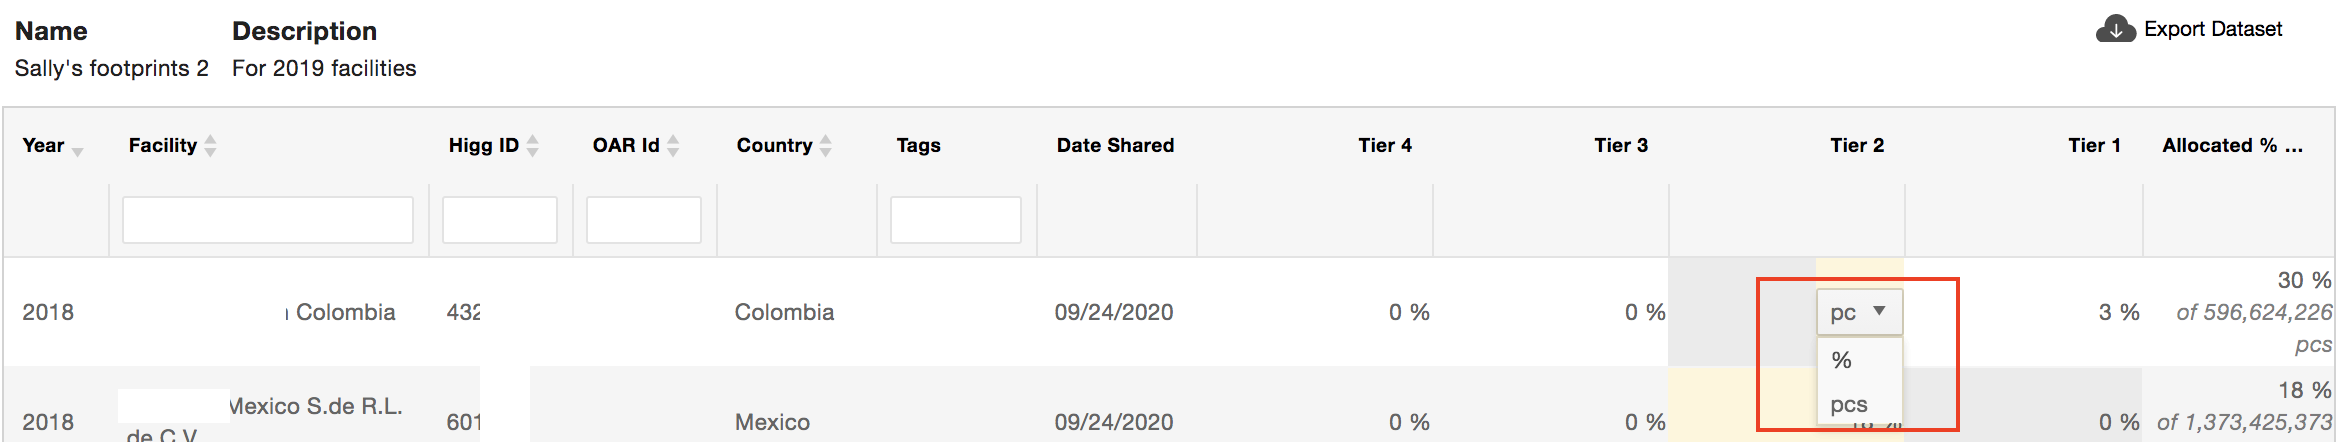
- Add allocation unit of production to supply impacts
In any tier for a facility, you can enter a unit production allocation (e.g., unit piece, pair, kg or m2) and the unit is based on the one that has been entered in the FEM. Allocations can be filled out for multiple tiers for a facility. Our system has automatically identified the tier(s) based on the data provided by the facility in that year of Higg FEM and the identified tiers are highlighted in yellow. However, allocations can be filled out for multiple tiers (e.g., tier 1 and 2) for a facility. In the final column, the unit amount allocated is converted to percent of total annual facility production. The percent is the allocated amount summed across the tiers as a percent of the total facility annual production. For example, if 10% is entered in Tier 1 and 20% in Tier 2, then the final column would show 30% of the facility annual production as allocated.
5. Estimating Allocations Best Practices
When estimating production allocation, keep in mind that any allocations are a rough estimate because they represent all production at a factory and are not able to distinguish between high intensity and lower intensity processes and products. Additionally, supply impacts only provide impacts for facilities that have shared FEM to your account; as such, supply impacts are not a complete view into your entire Tier 1-4 supply chain impacts and should not be used as a comprehensive scope 3 reporting tool nor as a replacement for Higg Material Sustainability Index (MSI) and Higg Product Module. Instead, supply impacts should be viewed as an initial step towards providing visibility into supply chain impacts.
The allocations table page includes an Excel download ‘Export Dataset button’ that you can use to get a spreadsheet version of all the facility FEM and their annual productions to help you calculate offline the production allocations using the estimation methods below.
As a best practice, you can record the methodology you used for production allocation in the Supply Impacts Description box.
Brands/Retailers
Estimating by product unit
If you have access to an invoice system where the amount of product unit purchased or received is available, you can use that information to estimate allocations. For example, if you know that you bought 22kg of material from a supplier and the facility unit of measure in Higg FEM is “kilogram” you can enter 22kg (and or convert to the unit of measure the facility has available). Most facilities report in kilogram (kg) or pieces (pcs).
Because Supply Impacts uses FEM, the production allocations should be aligned to FEM year. Sometimes production will span across a FEM year. In that case, you can prorate the production by day/month. For example, if production began on October 1 and ended Jan 31, you would allocate 75% of the production to the first FEM year and 25% of the production to the second FEM year. Keep in mind as with all of these calculations they are rough estimates, and you can decide how detailed you want to go with these allocation methodologies.
Estimating by product cost
If you do not have access to product manufacturing unit amounts, you can use the cost of product manufacturing to estimate how much product was produced at the facility using the unit of measure for the FEM year (example kg, pieces, etc).
Estimating by percent of facility production
Sometimes the supply chain or purchasing department of your organization will know the percent of the facility’s production your organization represents. Check with the other departments in your organization to determine if they collect this information.
Future features
Future enhancements to Supply Impacts include the ability for a manufacturer to fill out an allocated impact on behalf of a brand or retailer, including allocated upstream facilities. The recipient brand or retailer would receive the anonymized allocated supply impacts without needing the underlying FEM shared to them.
Manufacturers
Manufacturers are uniquely positioned to provide more accurate allocations on behalf of a brand or retailer. While this initial version of Supply Impacts does not include the ability to share Footprints, we do expect to add that functionality in the future.
When allocating a percentage of production on behalf of a brand, we recommend that the manufacturer use the same unit of production that they used to fill out their FEM. For example, if the FEM was filled out in kilograms, then the amount of product per kilogram produced for the brand or retailer should be used. In some cases, the manufacturer may wish to adjust the percent production to account for difference in processes at a facility. For example, if there are many high process activities at the facility, but the Supply Impacts is for a low-energy intensive process, then the manufacturer may change the allocation percentage to reflect the lower production usage. If any adjustments like that are done, it is recommended to document in the description what allocation methodology was implemented for the Supply Impacts.
6. Analytics and Data Download
- Analytics
If your account is the Expanded or Advanced or Custom Service level, you will be able to test the Supply Impacts analytics. Go to your Supply Impacts library and click the “analytics” icon to access the Supply Impacts analytics data. If your account is the Basic or Essential Service level, you won’t be able to access the Supply Impacts analytics. To learn more about Higg.org platform account service plan, please visit here.
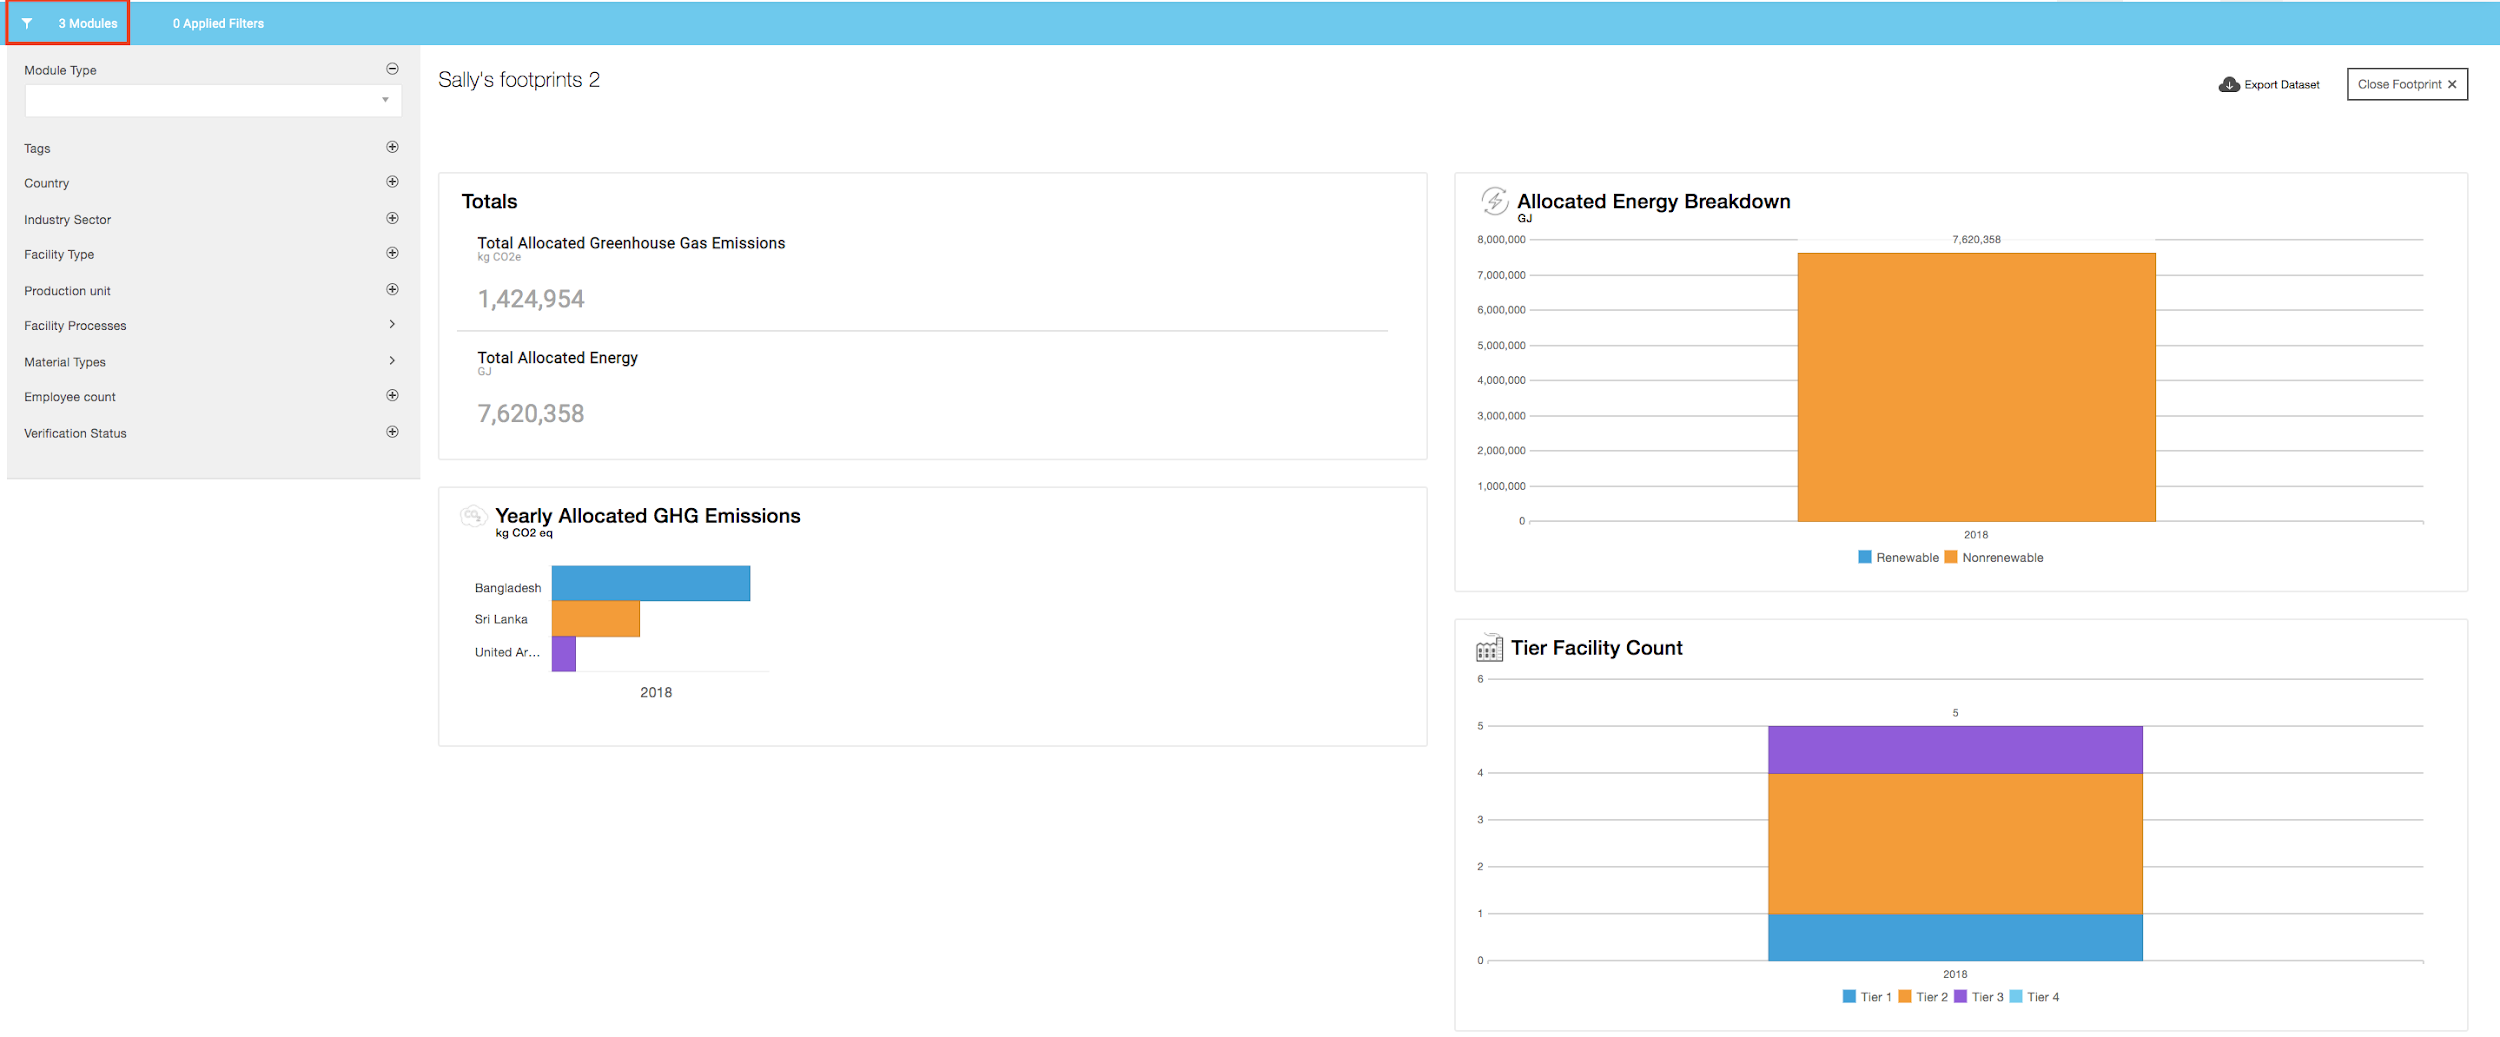
On the supply impacts analytics dashboard, you will see the total Higg FEM modules that you have allocated the impacts (e.g., on the sample screenshot, total 3 FEM modules were allocated the impacts) and you can choose the filters on the left side bar to create your own views.
There are four widgets to reflect the analytics data. 1) Total allocated GHG and Energy. It is calculated based on the % or units of production you have allocated. 2) Yearly Allocated GHG Emissions. It will be contributed by countries and year of FEM. 3) Allocated Energy Breakdown. The platform will indicate the energy with the renewable and nonrenewable energy consumption data. 4) The Facility Count. It shows the facility tier type and the total count of tiers that have been allocated with the impacts.
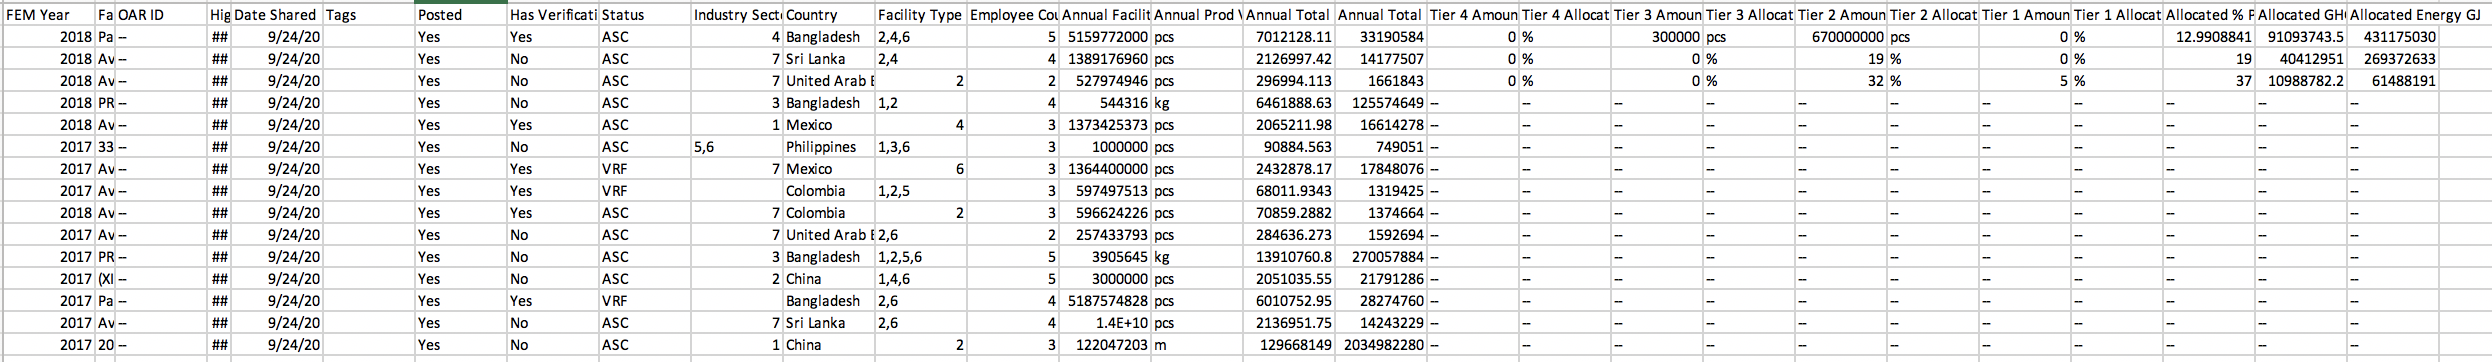
- Exporting the analytics data
If your account is the Basic or Essential Service level, you can only export the supply impacts analytics data but not access the supply impacts analytics board. Go to your supply impacts tool dashboard and click the “download impacts” icon in the library to export the supply impacts analytics data into a CSV file. All facilities with allocations (e.g., the impacts) and their allocations should download. To learn more about Higg.org platform account service plan, please visit here.
7. Editing Supply Impacts
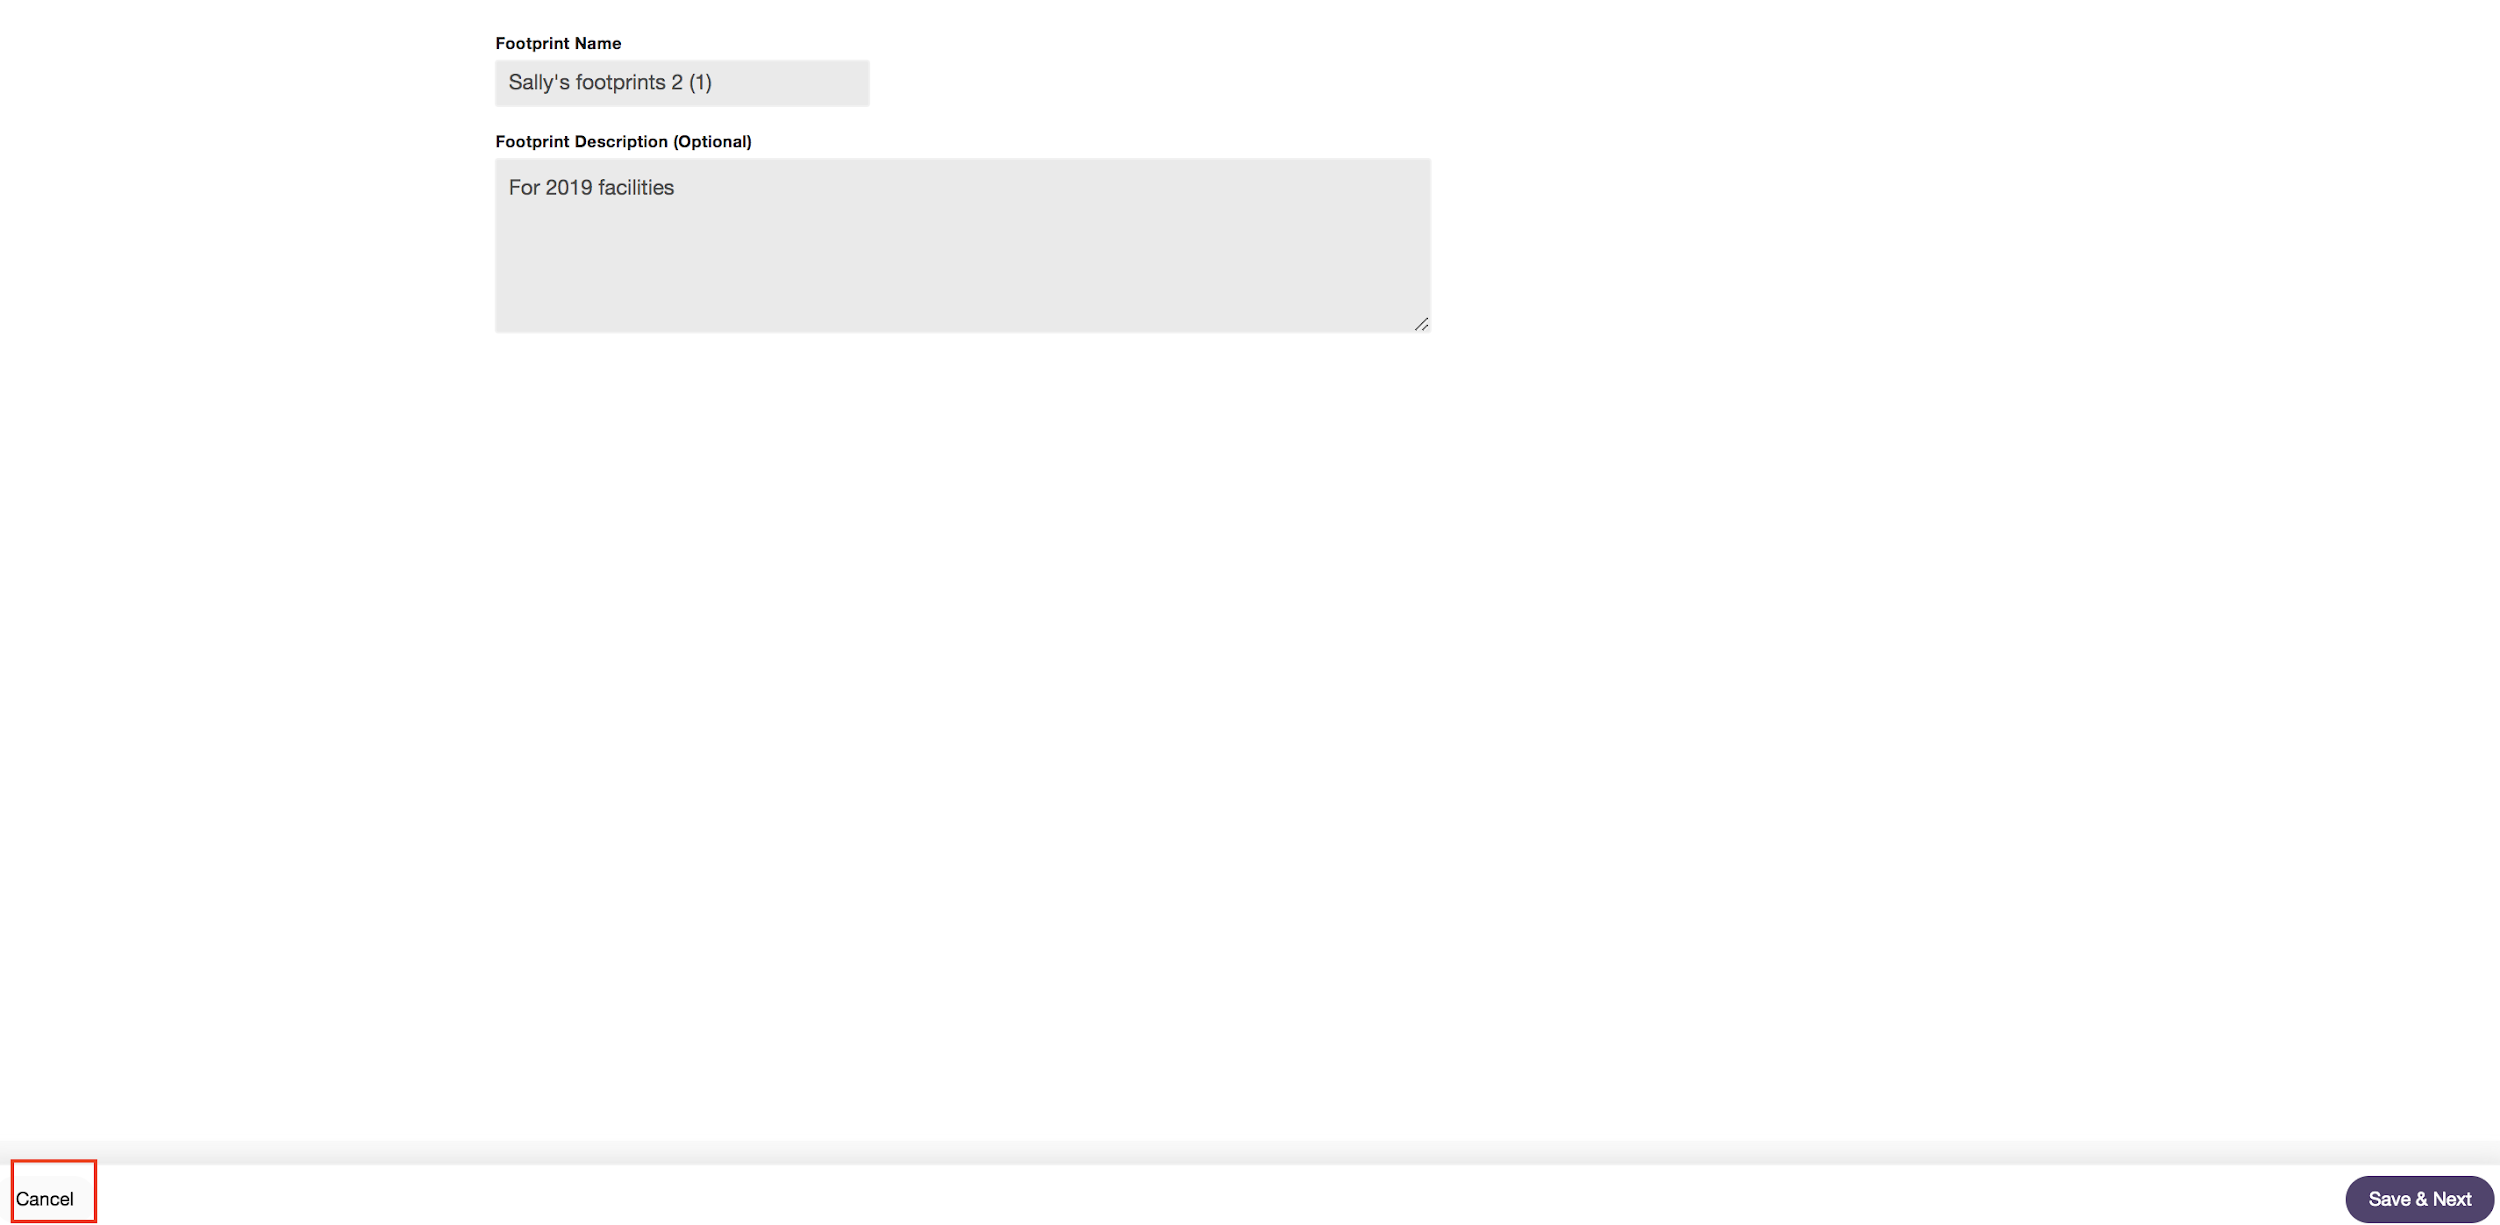
Click on the “Edit” icon in the library. Make changes to supply impact name and allocations and hit the “Save & Next” button.


You can also click the “Cancel” button on this page so you will return to the library.
8. Duplicating Supply Impacts
Click on the “copy” icon in the library and create a copy of an impact. You can continue to click the “Edit” icon to change the name of the newly created supply impacts.
9. Deleting Supply Impacts
Click on the “delete” icon in the library to delete the created supply impacts. You should get a warning and then be able to delete the impact. Supply Impacts is no longer visible in the library after it is deleted.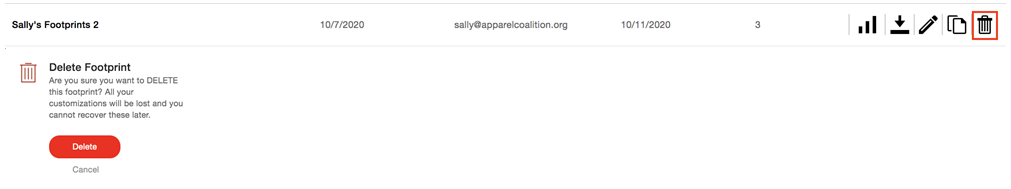
10. User Permission
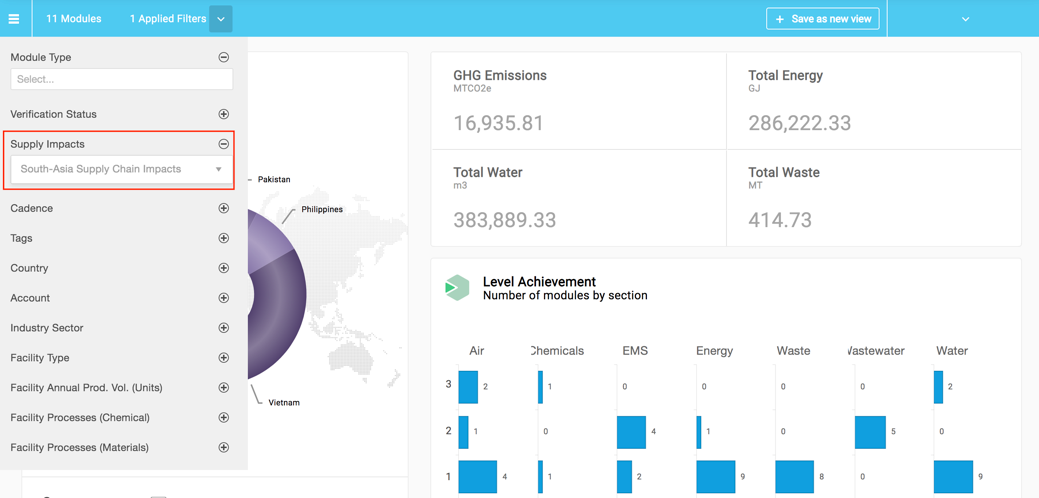
The owner/admin/editor role of your account has the same permission and functionalities as above introduced. The reviewer role of your account can’t create supply impacts, export supply impacts data, access the supply impacts analytics, copy the supply impacts, edit or delete the supply impacts.11. Analytics Tool with Impacts Allocation
If your account is subscribed with the Expended or higher level, you will be able to see the data analysis for the facilities who have been allocated with impacts. You will choose the impacts you have created from the “Supply Impacts” filter on Analytics tool and it will show that group of facilities’ data analysis. You can click here to learn how to use the Analytics tool.