Access Module Data
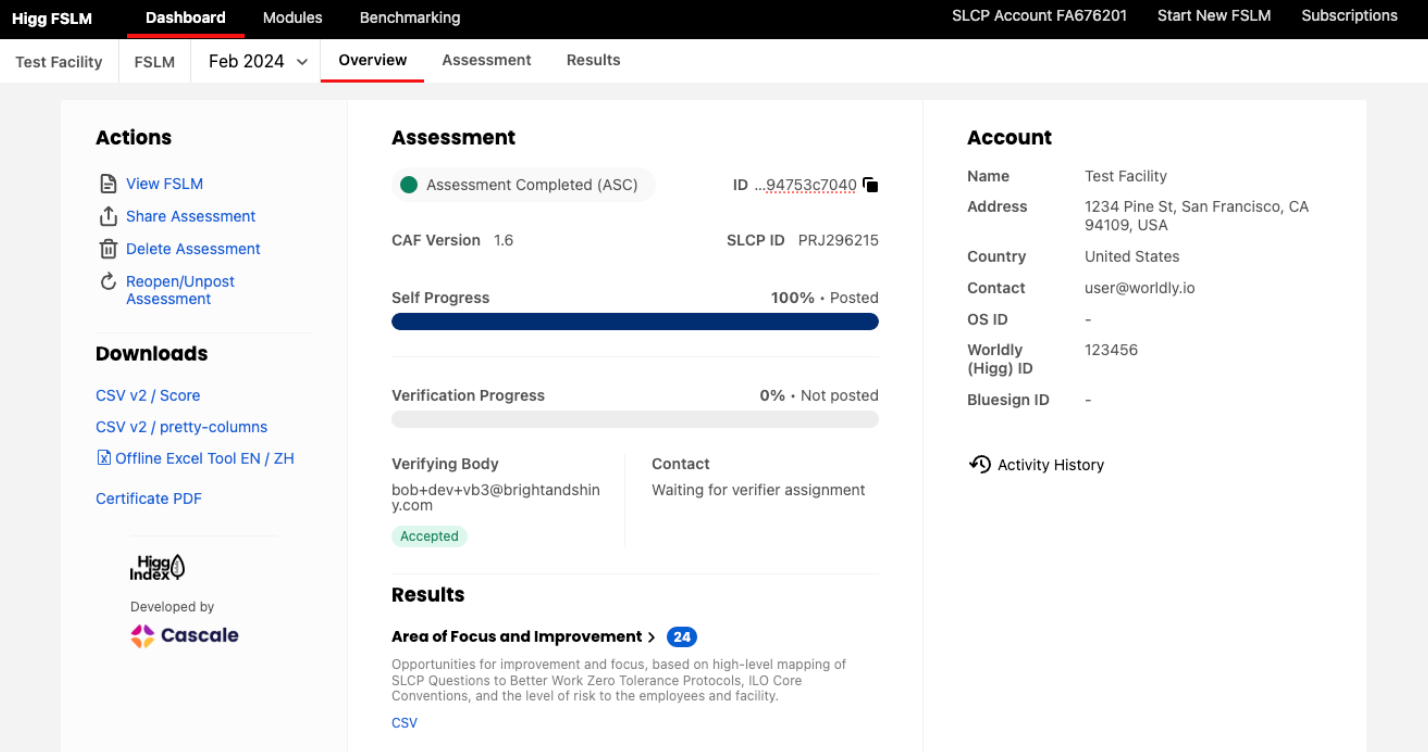
To access module data and results reports, first please confirm that the FSLM has been submitted and posted. Once it is posted, you can access the results reports from the FSLM dashboard.
Scoring
The Higg FSLM gives users score reports with scores on FSLM-steps, risks and legal after completing the assessment. With the scores, users can:
- Evaluate the Higg FSLM performance
- Track progress over time
- Compare the performance to that of similar facilities.
Please note: If you don’t have a valid operating license, your module score will be 0.
The Higg FSLM gives users a total score as well as additional score reports with scores on FSLM-steps, risks and legal after completing the assessment. With the scores, users can:
- Evaluate the Higg FSLM performance
- Track progress over time
- Compare the performance to that of similar facilities.
Please note: If you don’t have a valid operating license, your module score will be 0.
To understand the scores and achievement levels, please review the Higg FSLM scoring system guide here.
Section scores
On the Section scores page, you can see the section scores for each of the content sections in the tool.

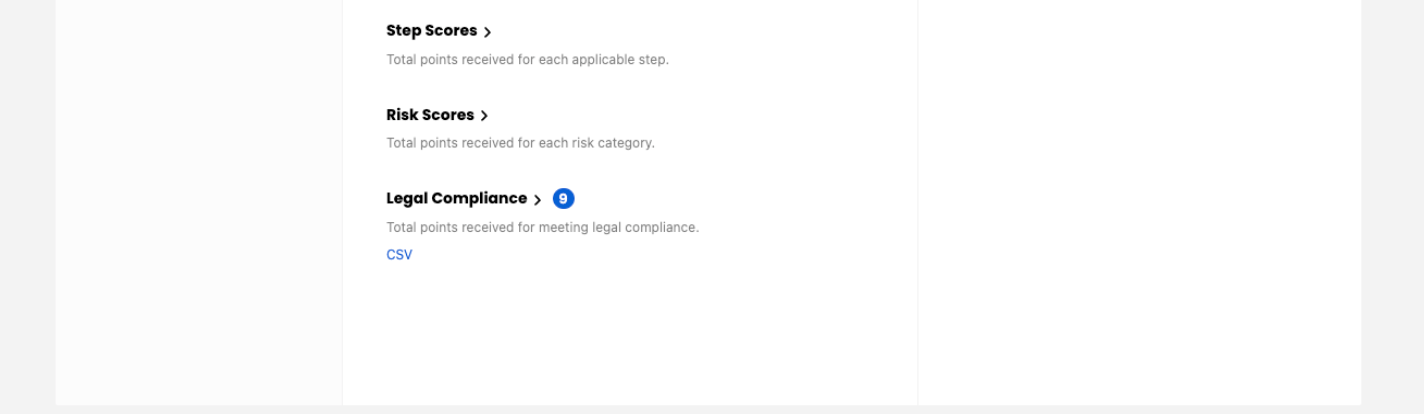
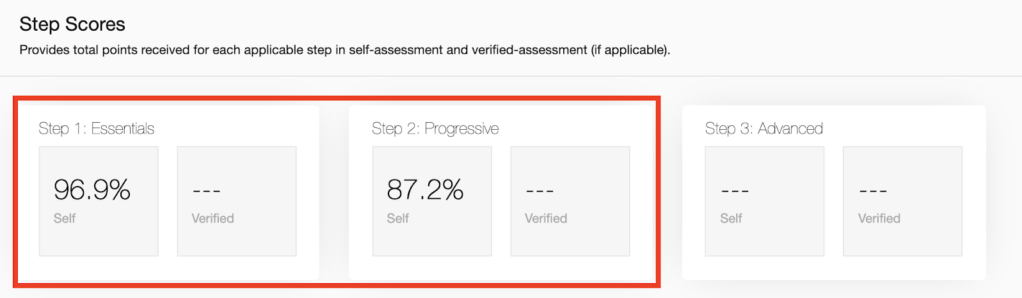
Step scores
On the Step scores page, you can see the total points received for each applicable step in the FSLM.
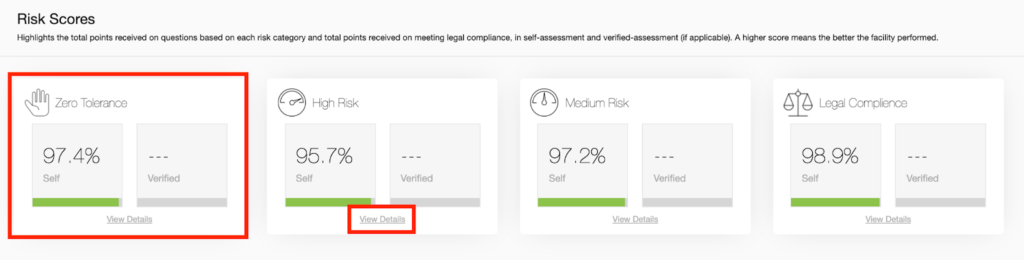
Risk scores
The risk scores report highlights the total points received on questions based on each risk category and total points received on meeting legal compliance. A higher score means the better the facility performed.
Click view details to go directly to the Areas of Focus and Improvement Report.
Additional Results Reports
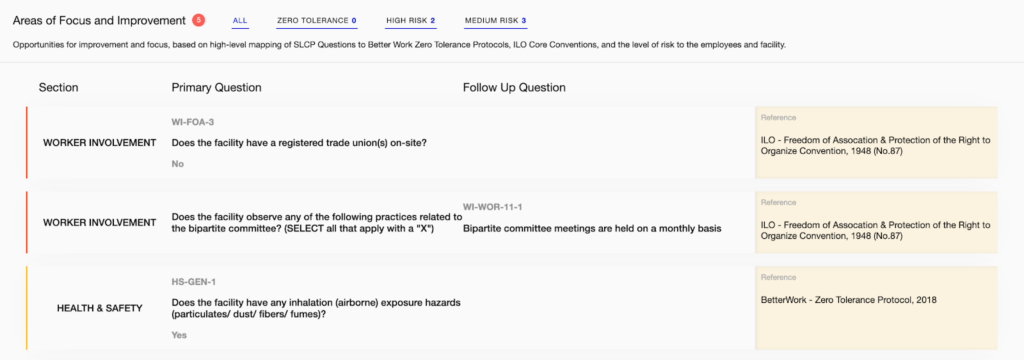
Areas of Focus and Improvement Report
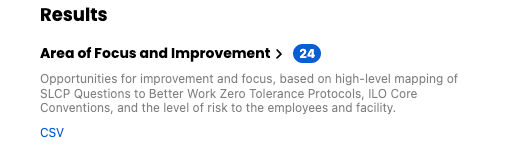
This report shows the opportunities for improvement and focus based on the high-level mapping of SLCP Questions to Better Work Zero Tolerance Protocols, ILO Core Conventions, and the level of risk to the employees and facility. The questions are categorized as all questions, zero tolerance, high-risk and medium-risk questions.
You can also download this report into a CSV file on the FSLM dashboard.
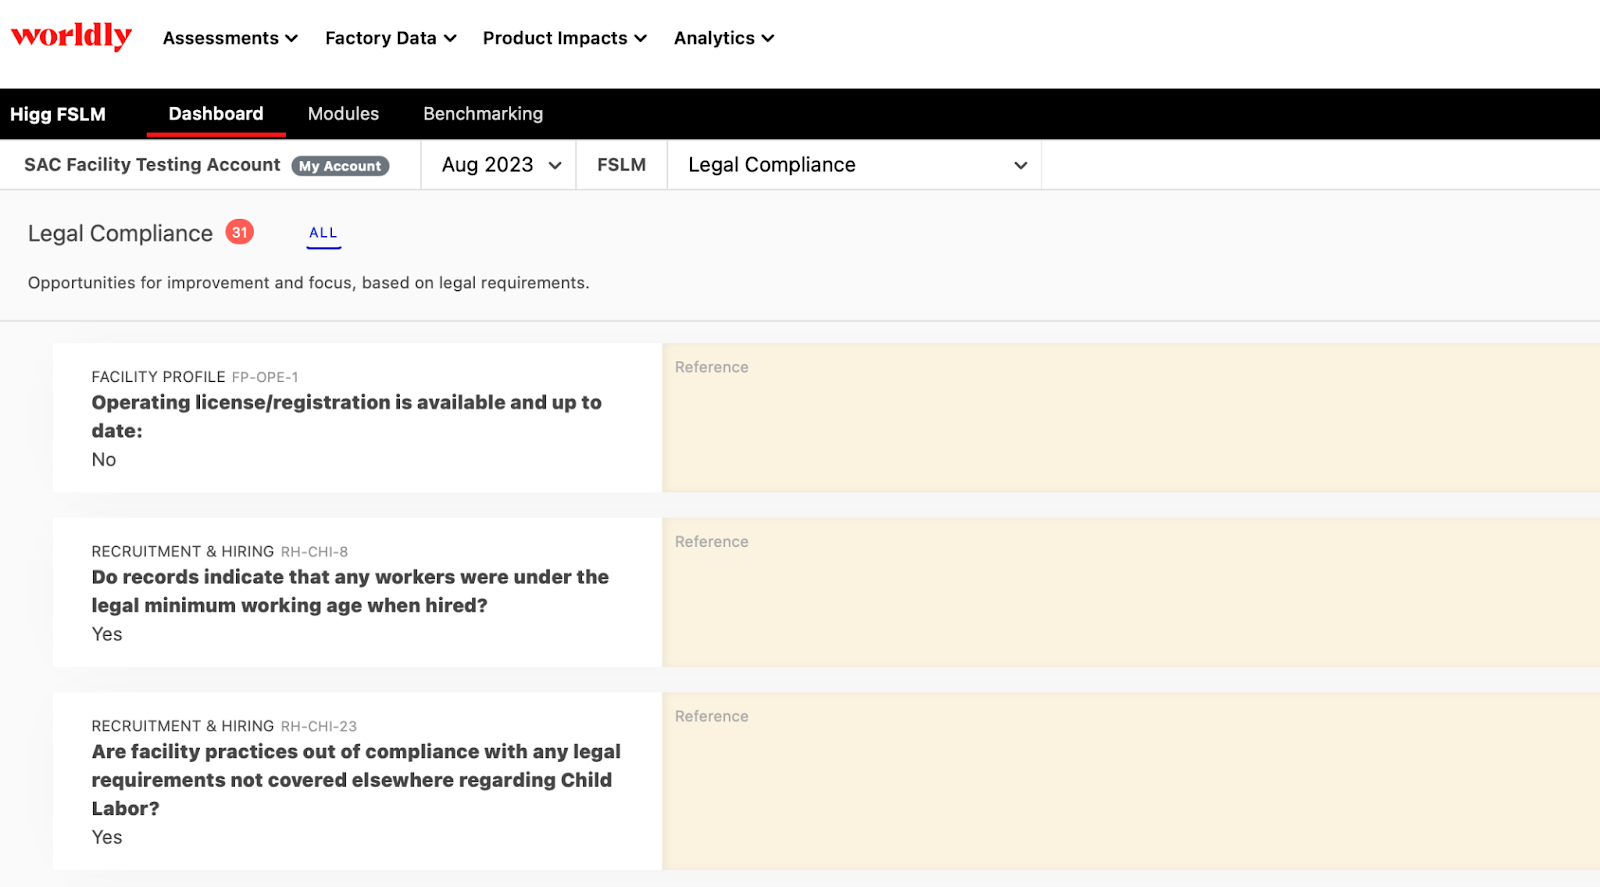
Legal Compliance Report
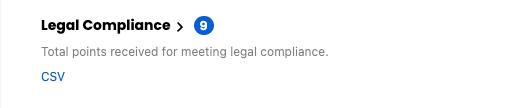
The legal compliance report provides opportunities for improvement and focus, based on legal requirements.
You can also download this report into a CSV file on the FSLM dashboard.
Benchmarking
The Worldly benchmarking tool allows users to compare their FSLM performance with all the industry data in the Worldly platform and gain deep insight into how their social and labor practices rank against the rest of the industry. It helps users measure their performance compared to industry averages and highlights areas of focus and improvement for facilities. Granular and filterable data will inform the facilities, manufacturing groups, and brands of areas of improvements and industry leadership so that they can make informed decisions on their pathway to becoming a leader in social and labor practices.
Same as the FEM benchmarking tool, facilities, brands/retailers or large manufacturers will use this tool. Facility users can use it to compare their own posted FSLM with the industry average FSLM performance. Brands/retailers/large manufacturers can use it to compare all received shared and posted FSLMs with the industry average FSLM performance. However, they can’t compare a single shared and posted FSLM from all received shared and posted FSLMs in this tool.
Brands/retailers/large manufacturers who have shared and posted FSLMs have access to the FSLM benchmarking tool. The FSLM benchmarking tool is available for comparing modules from CAF 1.4 and up.
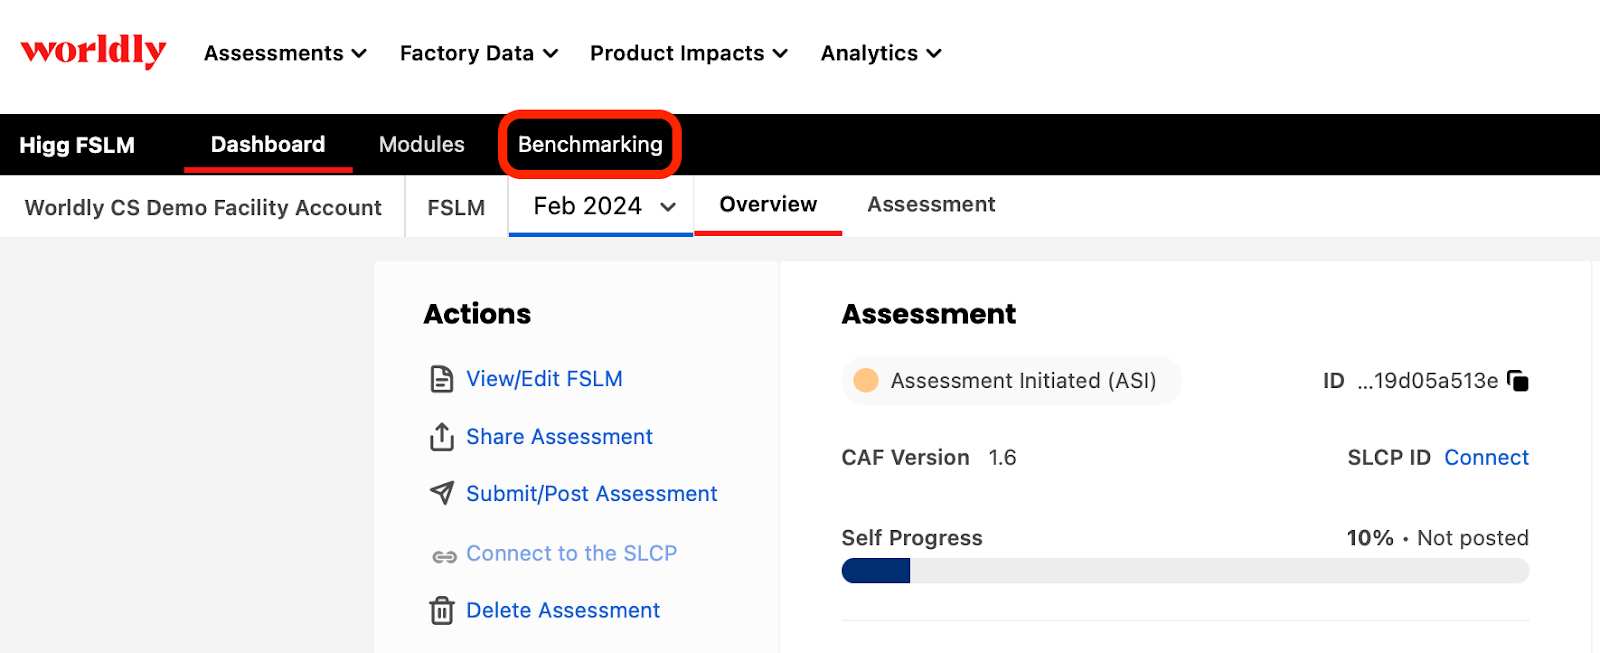
Click the FSLM tab and then select ‘Benchmarking’ to get into the benchmarking page.
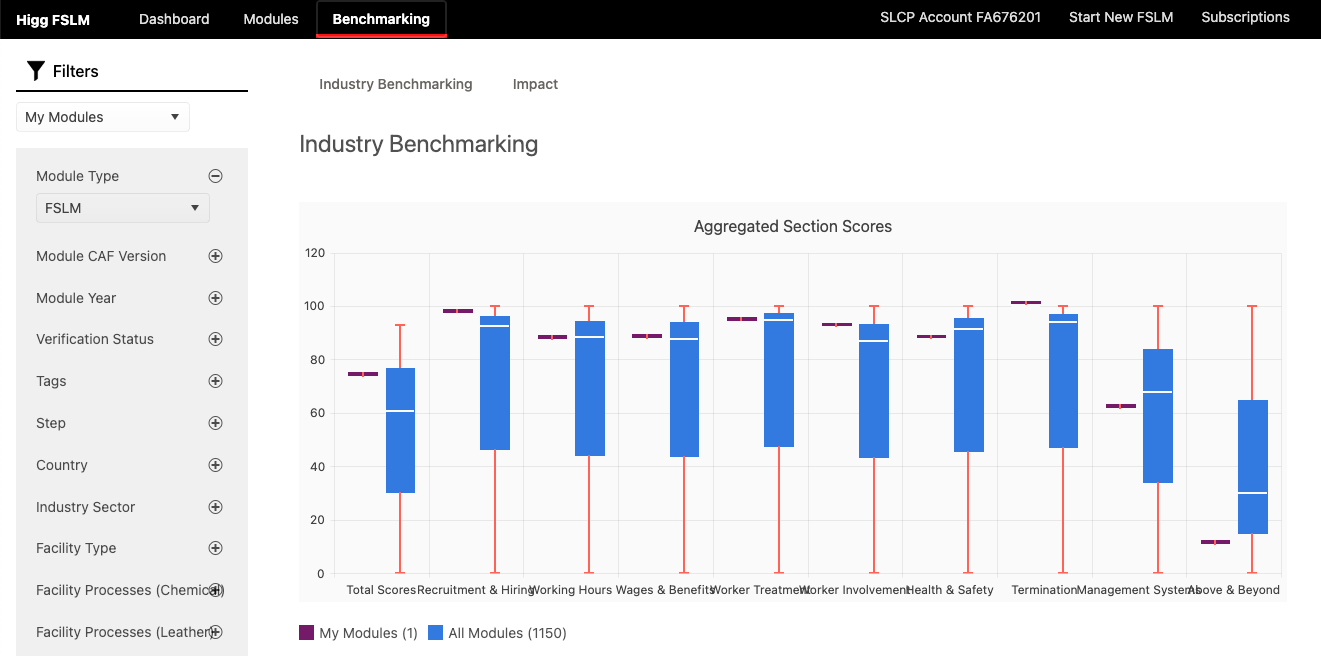
The left side filter bar can set up the comparison conditions. The filters and information is from the Facility Profile section in the FSLM. By using the filters, users will be able to view the Industry Benchmarking and Impact charts.
Industry Benchmarking
In the center of the page, see the ‘Aggregated Section Scores’, ‘Aggregated Step Scores’, and the ‘Aggregated Risk Scores’ sections. Across the benchmarking tool, your module data is shown in purple and the industry average is displayed in blue.
On the left, select one or multiple filters to narrow the industry data shown by module year, verification status, industry, and more. These filters allow you to compare your performance to facilities similar to yours.
For each section, hover over the chart to see more details:
- Upper = highest recorded score in our system
- Lower = lowest recorded score in our system
- Bottom quartile = 25% of modules scored below this number
- Top quartile = 25% of modules scored above this number
- Median = median score of all module
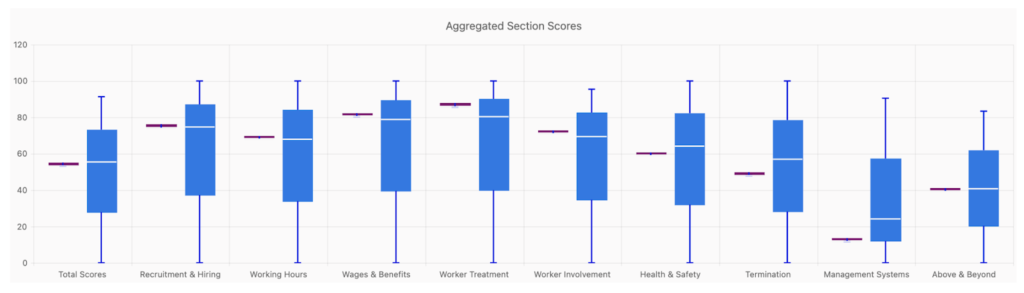
‘Aggregated Section Scores’ – The section shows your section scores compared to industry data.
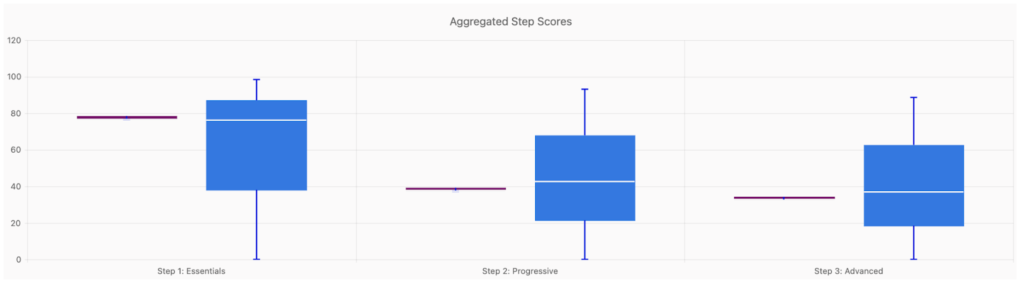
‘Aggregated Step Scores’ – The section shows your total points received for each applicable step of the assessment.
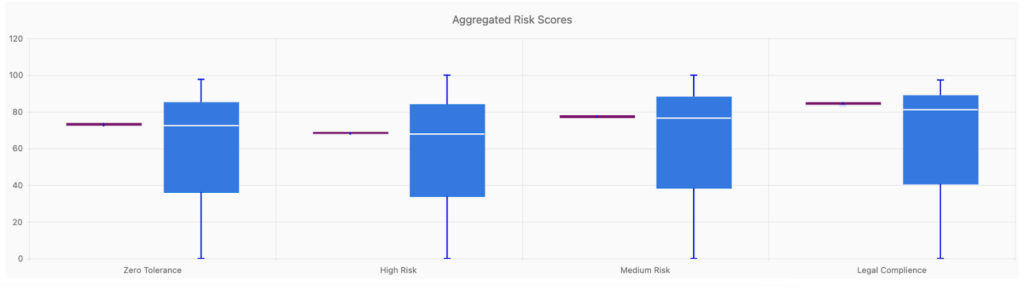
‘Aggregated Risk Scores’ – The section shows the points received on questions based on each risk category and total points received on meeting legal compliance. A higher score means the better the facility performed.
Impact
There are two Impact charts within the Tab.
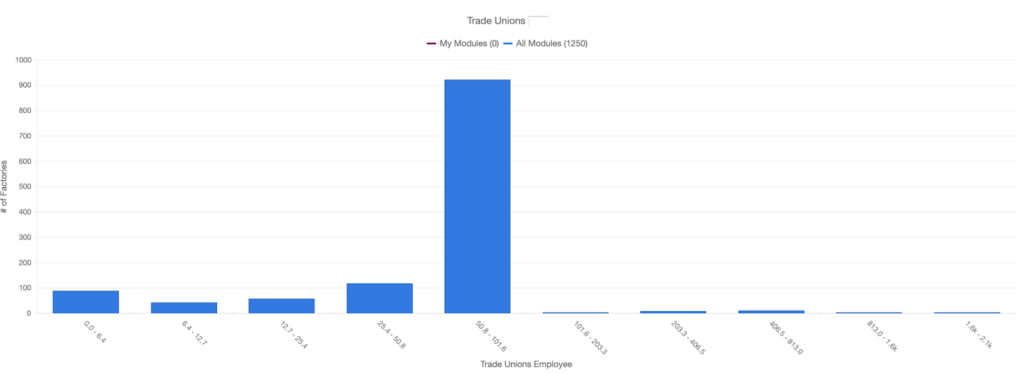
Employee Who Are Members of the Trade Unions
Which is calculated by “foa-cb-2–3“ multiple by Ref ID “FP-WOR-1.”
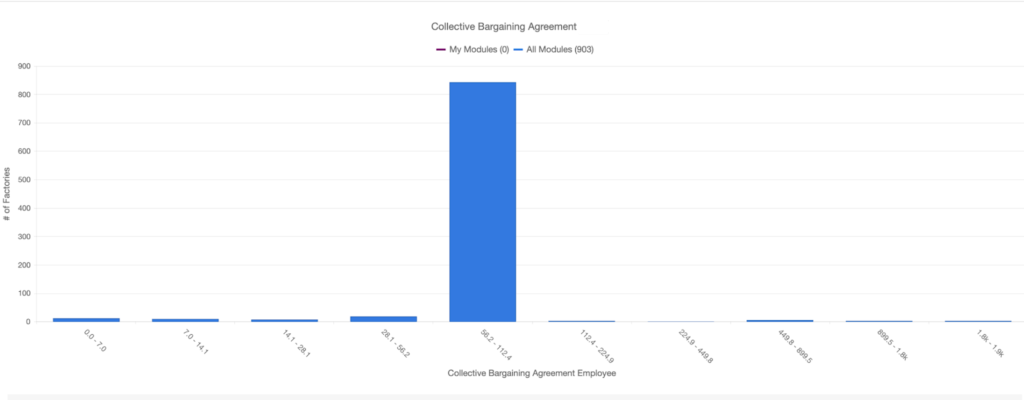
Employee Covered Under The Most Covered Collective Bargaining Agreement
Which is calculated by Ref ID “wi-foa-41 “ multiplied by Ref ID “FP-WOR-1.”
Trade Union and Collective Bargaining are one of the many social aspects and social practitioners in the field have been trying to advocate for decades. Allowing visibility to users on this front may promote them to do more on this area if they haven’t already.
Enabling users to see and compare how they are performing on the Collective Bargaining and Trade union of their like-facility can help them to either expedite their progress on this aspect if not already at their max, or make them differentiate their better performance in this area.